

The new methodical approach of using ethanol as internal standard in gas chromatographic analysis of volatile compounds in spirit drinks in daily practice of testing laboratories is proposed. This method provides determination of volatile compounds concentrations in spirit drinks directly expressed in milligrams per liter (mg/L) of absolute alcohol according to official methods without measuring of alcohol strength of analyzed sample.
The main difference of the proposed method "ethanol as ISTD" from classical method of IS in this case is the following. In the classical case calibration of chromatograph includes the measuring of relative detector response factors for every analyzed compound relative to IS. Numeric values of these factors RFi are calculated from chromatographic data for standard solutions with known concentrations of analyzed compounds and may be expressed by the following equation:
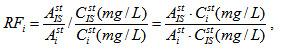 |
(1) |
where Asti and AstIS are peak areas of i-th compounds and IS respectively; Csti (mg/L) and are concentrations of i-th compounds and IS respectively expressed in mg per 1 liter of solution. Concentration of i-th sample compound relative to absolute alcohol Ci [mg/L] is expressed by the following formula [1–3]:
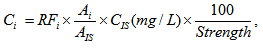 |
(2) |
where Ai and AIS are the peak areas for i-th compound and IS respectively, CIS (mg/L) is concentration of IS, Strength is concentration of alcohol in solution expressed in % volume. In the case of "ethanol as ISTD" the formulas (1) and (2) looks as follows:
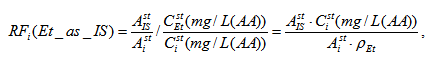 |
(3) |
where Csti is concentration of i-th compounds expressed in mg per 1 liter of absolute alcohol, ρEt = 789300 mg/L is the density of ethanol. Concentration of i-th sample compound relative to absolute alcohol Ci [mg/L(AA)] is expressed by the following formula:
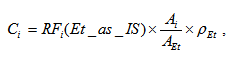 |
(4) |
According to (4) we obtain value of i-th sample compound concentration directly expressed in mg per 1 liter of absolute alcohol directly without any additional measurement of strength and without of any procedure of IS adding in an analyzed sample.
To compare proposed methodical approach "ethanol as ISTD" with classical commonly used method of internal standard experimental researches were planned and executed. Seven standard ethanol-water (96:4) solutions VC and VCC were prepared by weight. Concentrations of analyzed volatile compounds in the prepared solutions are presented in Table 1. The standard solutions of volatile compounds VC-1, VC-2 and VC-3 were used to generate calibration curves. The standard solutions VCC-0, VCC-1, VCC-2, VCC-3 and certified reference materials GSO-8404 and GSO-8405 were used to control trueness (ISO 5725-1994. Accuracy (trueness and precision) of measurement methods and results) of the proposed methodical approach. Every standard solution was injected two times.
| Compound | Concentration, mg/L (AA) | Relative error, % (P=0,95%) | ||||||
| VC-1 | VC-2 | VC-3 | VCC-0 | VCC-1 | VCC-2 | VCC-3 | ||
| acetaldehyde | 111 | 11,2 | 1,13 | 4275 | 1096 | 56,2 | 2,22 | ± 3% |
| methyl acetate | 114 | 11,5 | 1,17 | 4397 | 1128 | 57,8 | 2,29 | ± 3% |
| ethyl acetate | 108 | 10,9 | 1,11 | 4173 | 1070 | 54,9 | 2,17 | ± 3% |
| methanol | 1092 | 113,3 | 14,3 | 41995 | 10774 | 555,5 | 24,96 | ± 3% |
| 2-propanol | 105 | 12,1 | 2,70 | 3991 | 1025 | 54,1 | 3,69 | ± 3% |
| 1-propanol | 104 | 10,5 | 1,06 | 4012 | 1029 | 52,8 | 2,08 | ± 3% |
| isobutyl alcohol | 103 | 10,4 | 1,05 | 3975 | 1020 | 52,3 | 2,06 | ± 3% |
| n-butanol | 106 | 10,7 | 1,08 | 4071 | 1044 | 53,5 | 2,11 | ± 3% |
| isoamyl alcohol | 106 | 10,7 | 1,08 | 4071 | 1044 | 53,5 | 2,11 | ± 3% |
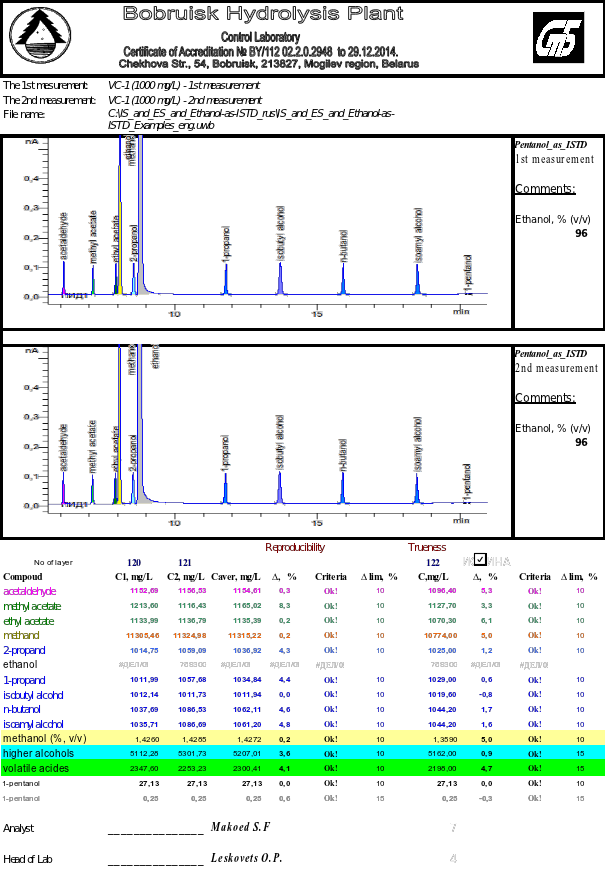
| 1-pentanol (IS) | 27,13 | 27,13 | 27,13 | 27,13 | 27,13 | 27,13 | 27,13 | ± 3% |
In all cases calibration coefficients were been generated by the considered three methods. At the first case 1-pentanol was used as IS. At the second case the ES method was used. And in the third case the ethanol as IS was used. Analytical characteristics of the obtained calibration coefficients are presented in Table 2.
| Compound | 1-pentanol as IS | ES | Ethanol as IS | LOD* (mg/L) | |||
| Slope | Correlation c-nt, R2 | Slope(mg/L)/(pA*min) | Correlation c-nt, R2 | Slope | Correlation c-nt, R2 | ||
| acetaldehyde | 2,396 | 0,9997 | 266,1 | 0,9997 | 1,710 | 0,9997 | 0,344 |
| methyl acetate | 2,491 | 0,9997 | 276,7 | 0,9996 | 1,779 | 0,9999 | 0,683 |
| ethyl acetate | 1,757 | 0,9997 | 195,1 | 0,9997 | 1,254 | 0,9999 | 0,322 |
| methanol | 2,133 | 0,9998 | 236,9 | 0,9997 | 1,523 | 0,9999 | 0,046 |
| 2-propanol | 1,400 | 0,9998 | 155,5 | 0,9997 | 0,999 | 0,9999 | 0,119 |
| ethanol | 1,413 | N/A | 155,5 | N/A | 1 | N/A | N/A |
| 1-propanol | 1,179 | 0,9997 | 130,9 | 0,9996 | 0,841 | 0,9999 | 0,222 |
| isobutyl alcohol | 1,018 | 0,9998 | 113,0 | 0,9997 | 0,727 | 0,9999 | 0,178 |
| n-butanol | 1,117 | 0,9999 | 124,1 | 0,9998 | 0,798 | 0,9999 | 0,189 |
| isoamyl alcohol | 1,030 | 0,9999 | 114,1 | 0,9998 | 0,735 | 0,9999 | 0,179 |
| 1-pentanol (IS) | 1 | N/A | 110,1 | N/A | 0,708 | N/A | 0,271 |
| *limit of detection (LOD) | |||||||
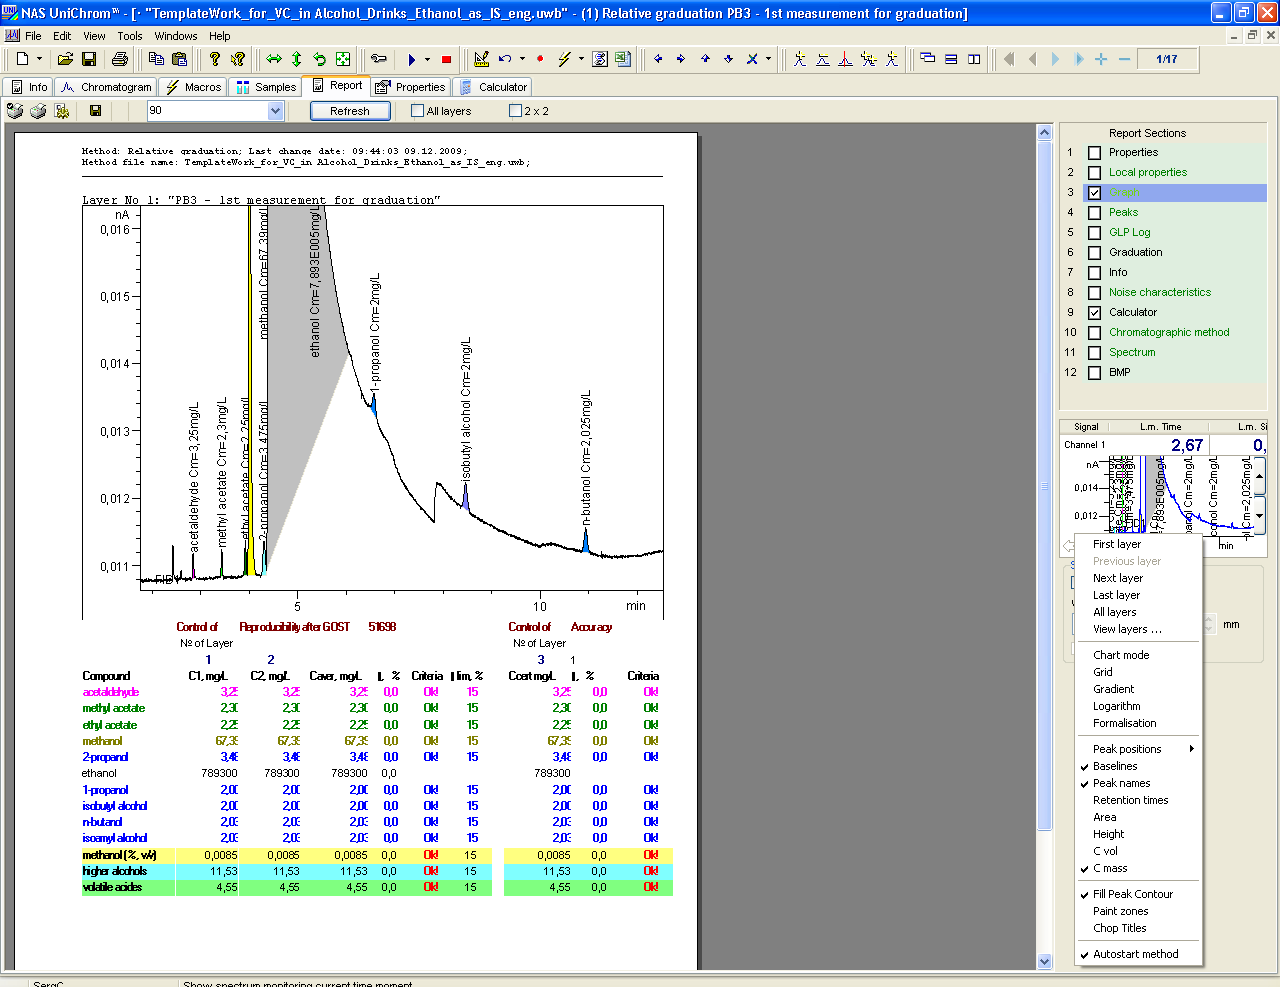
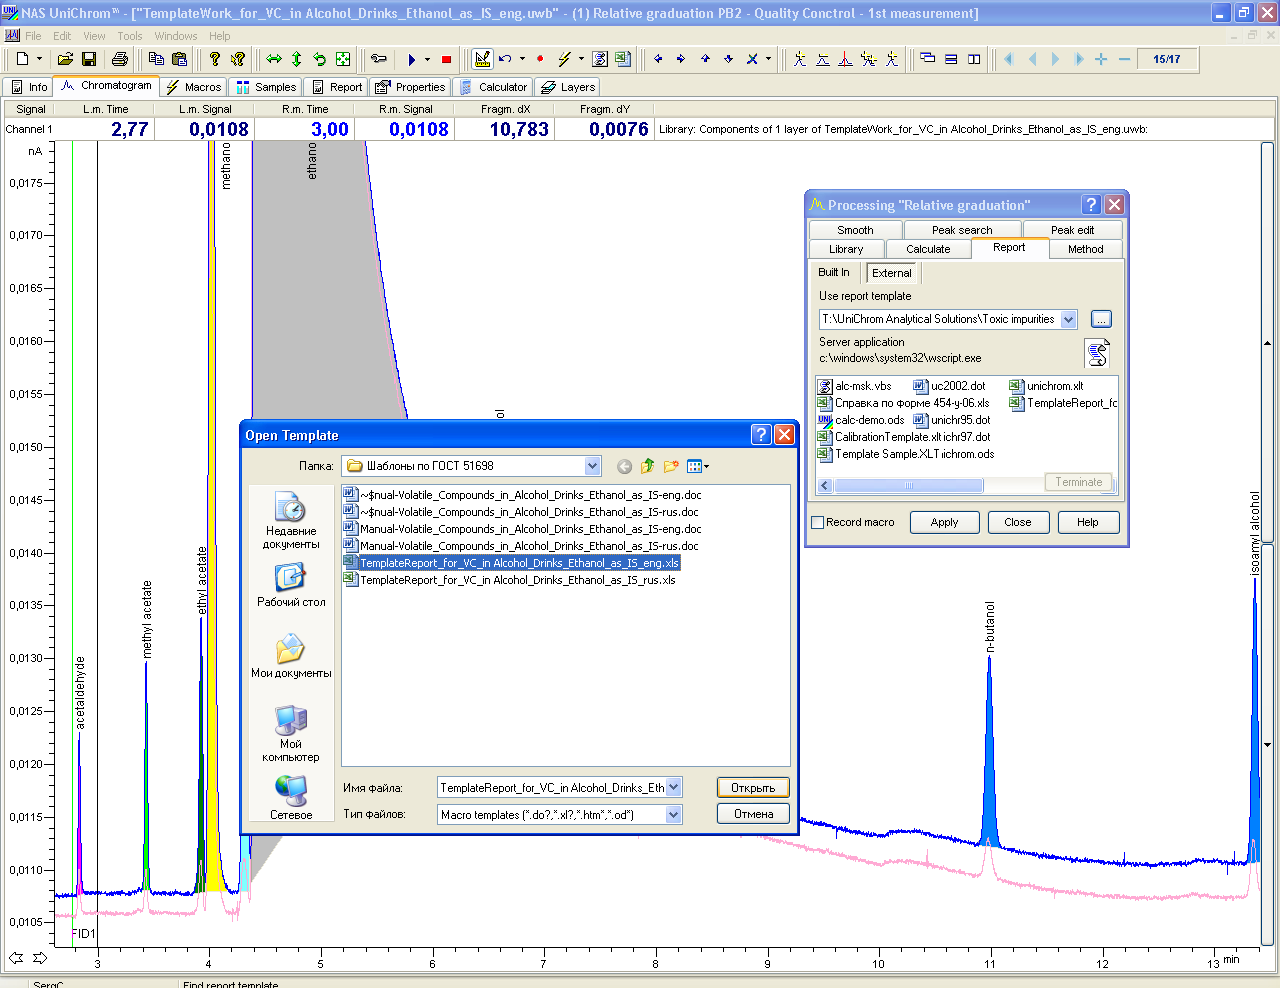
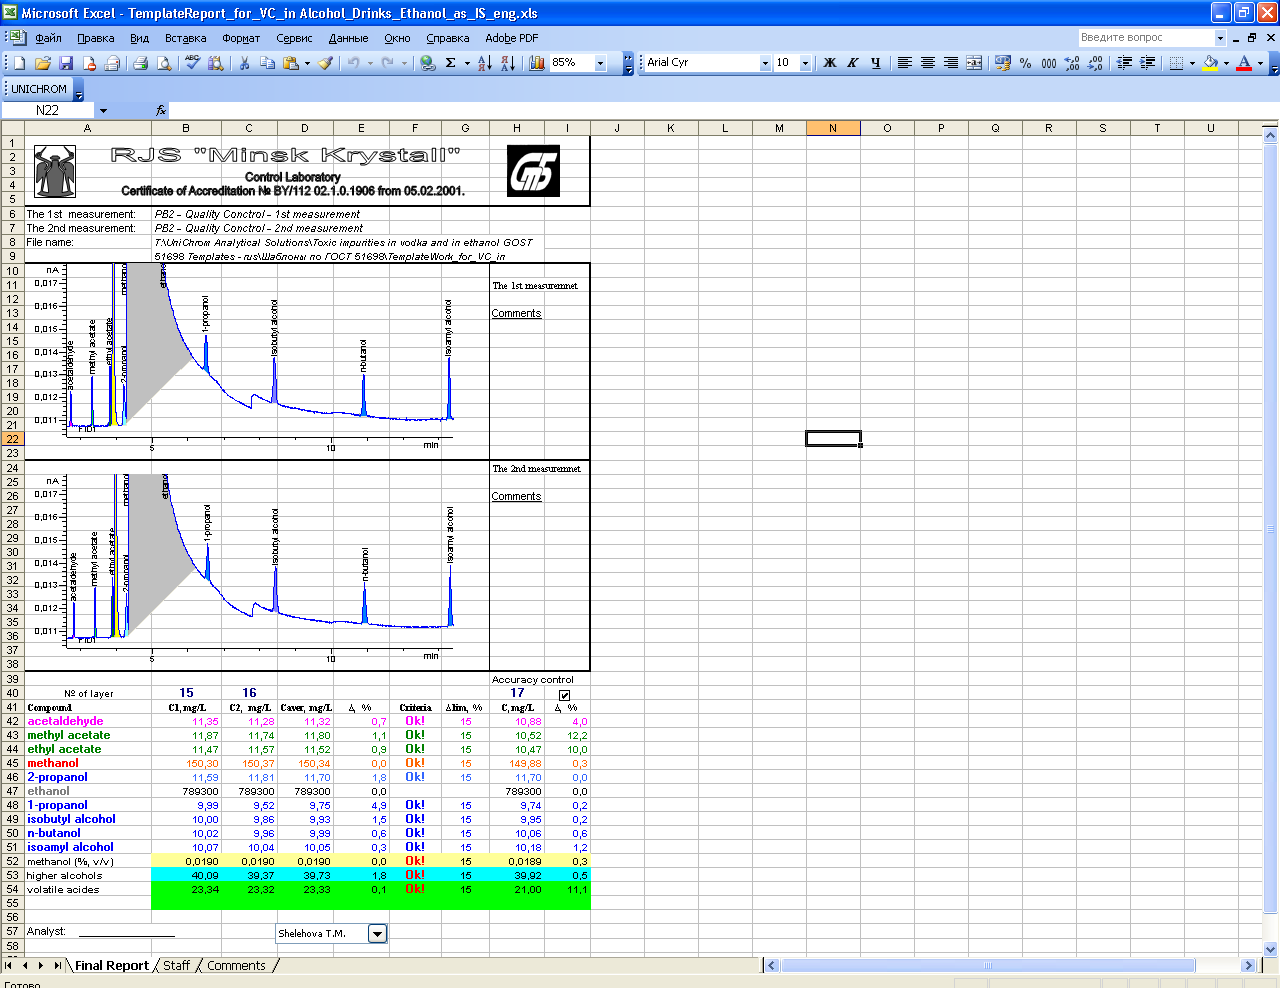
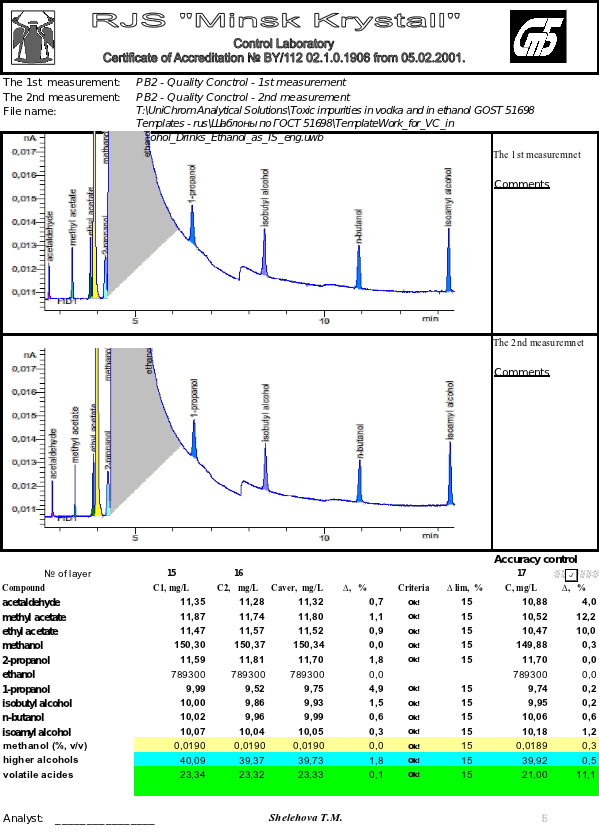
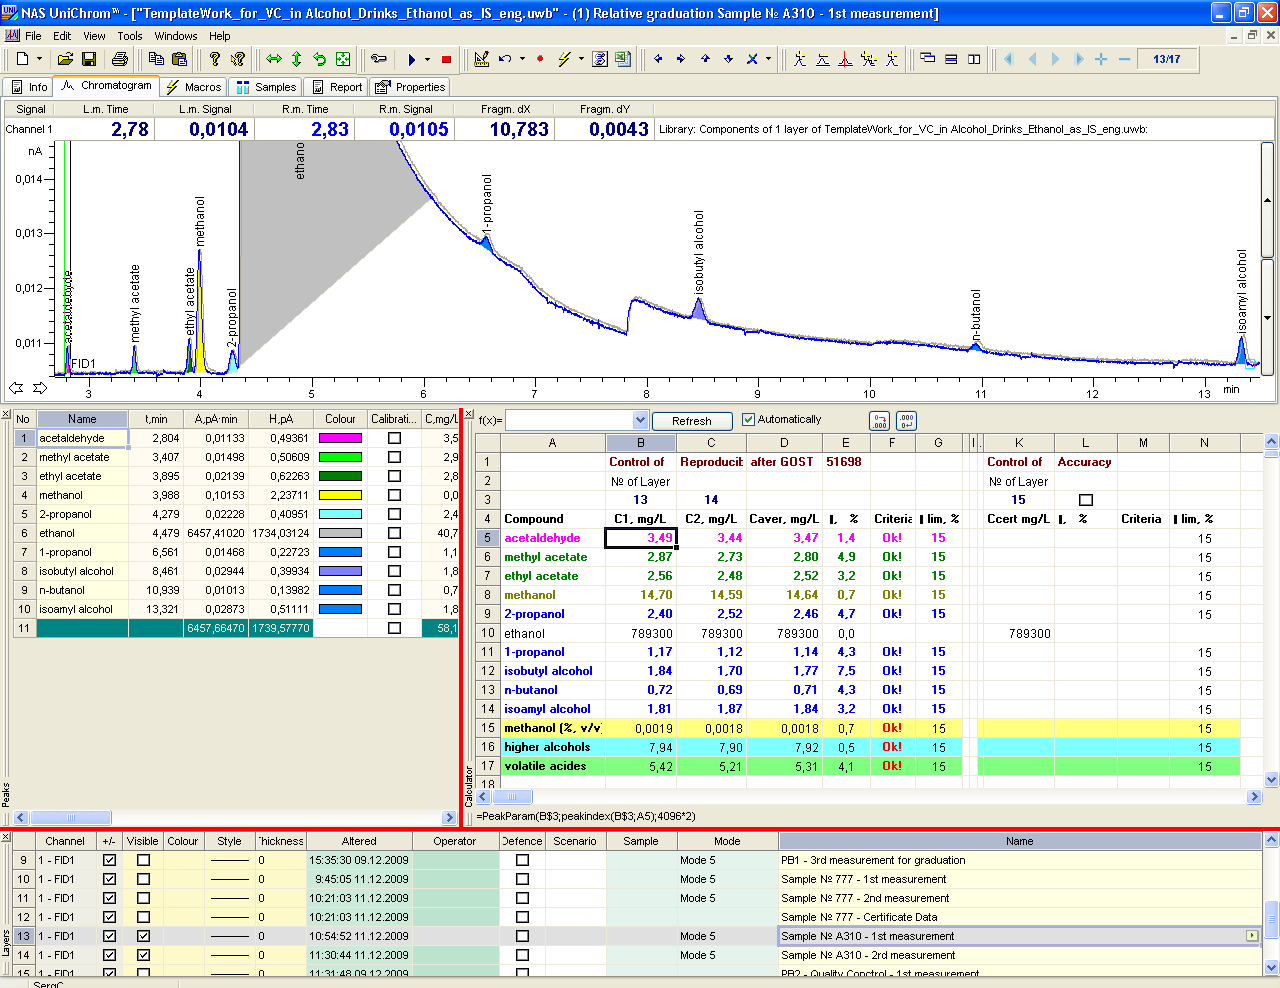
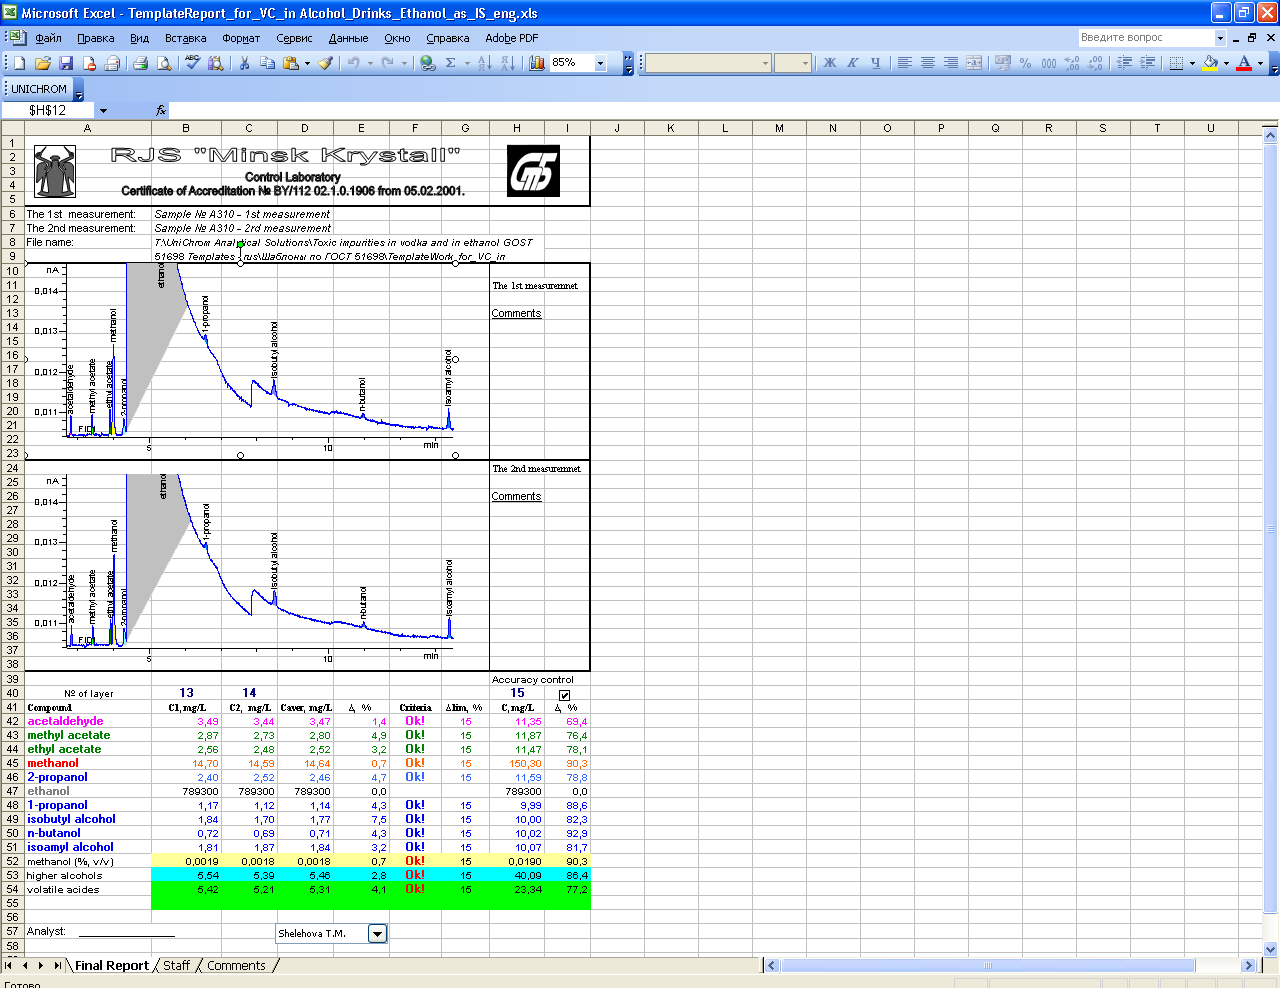
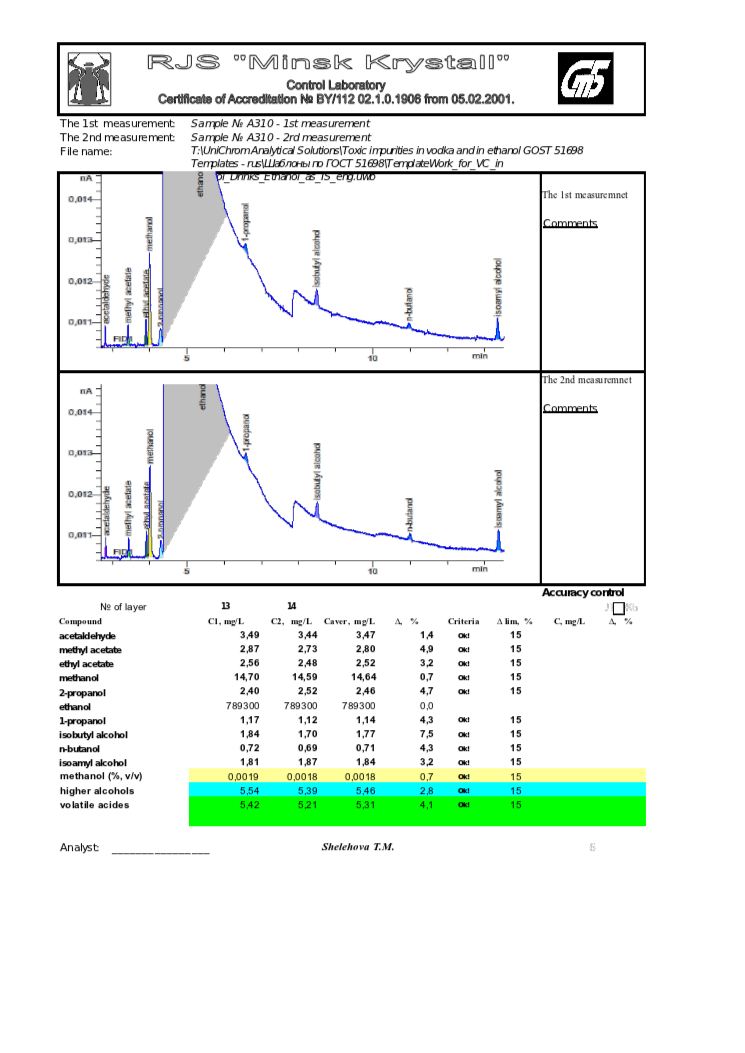
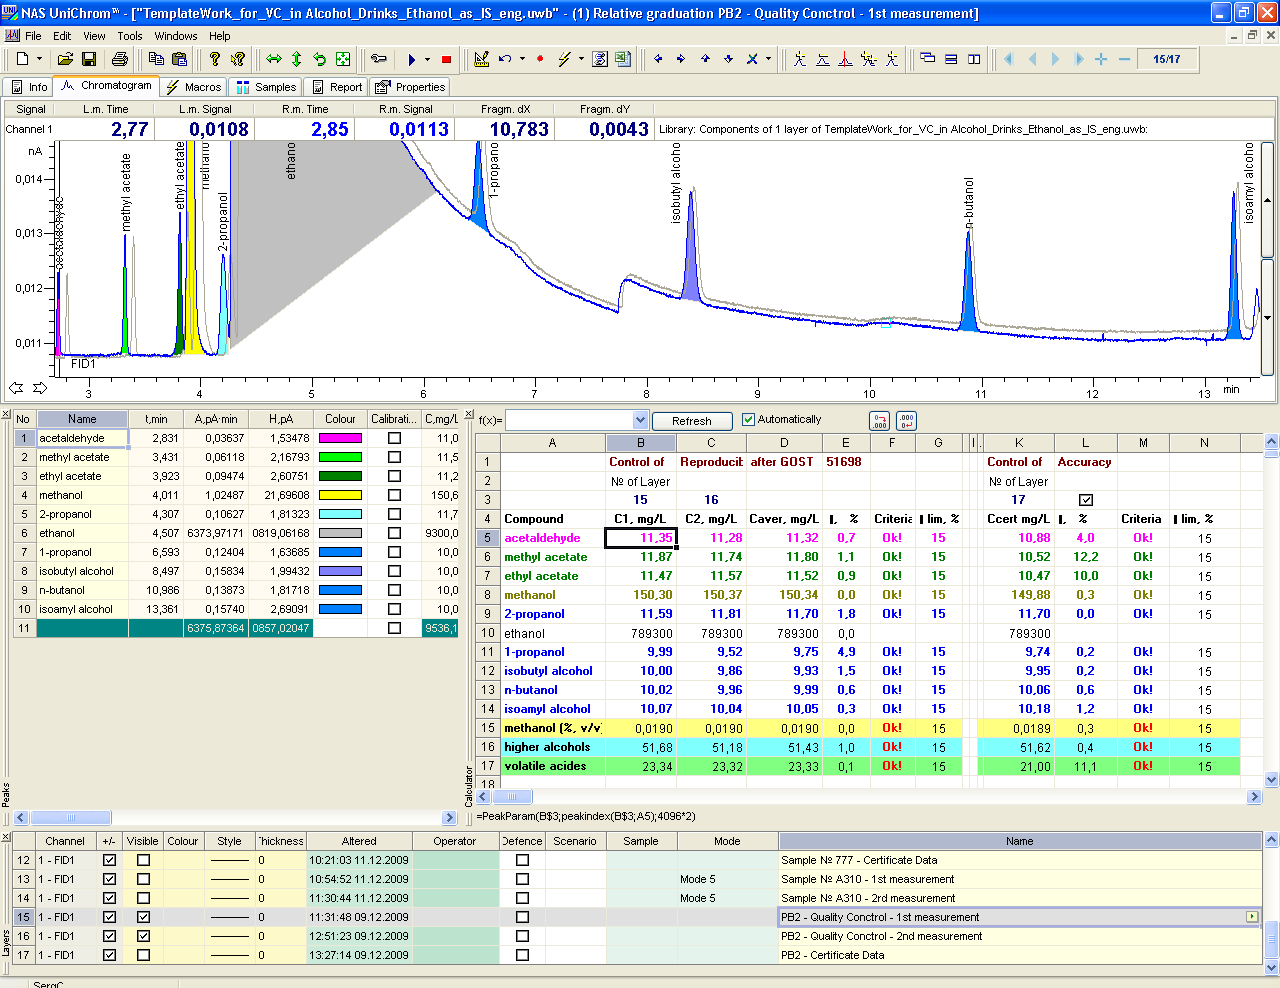
The main obtained experimental results are presented below in the form of screenshots.
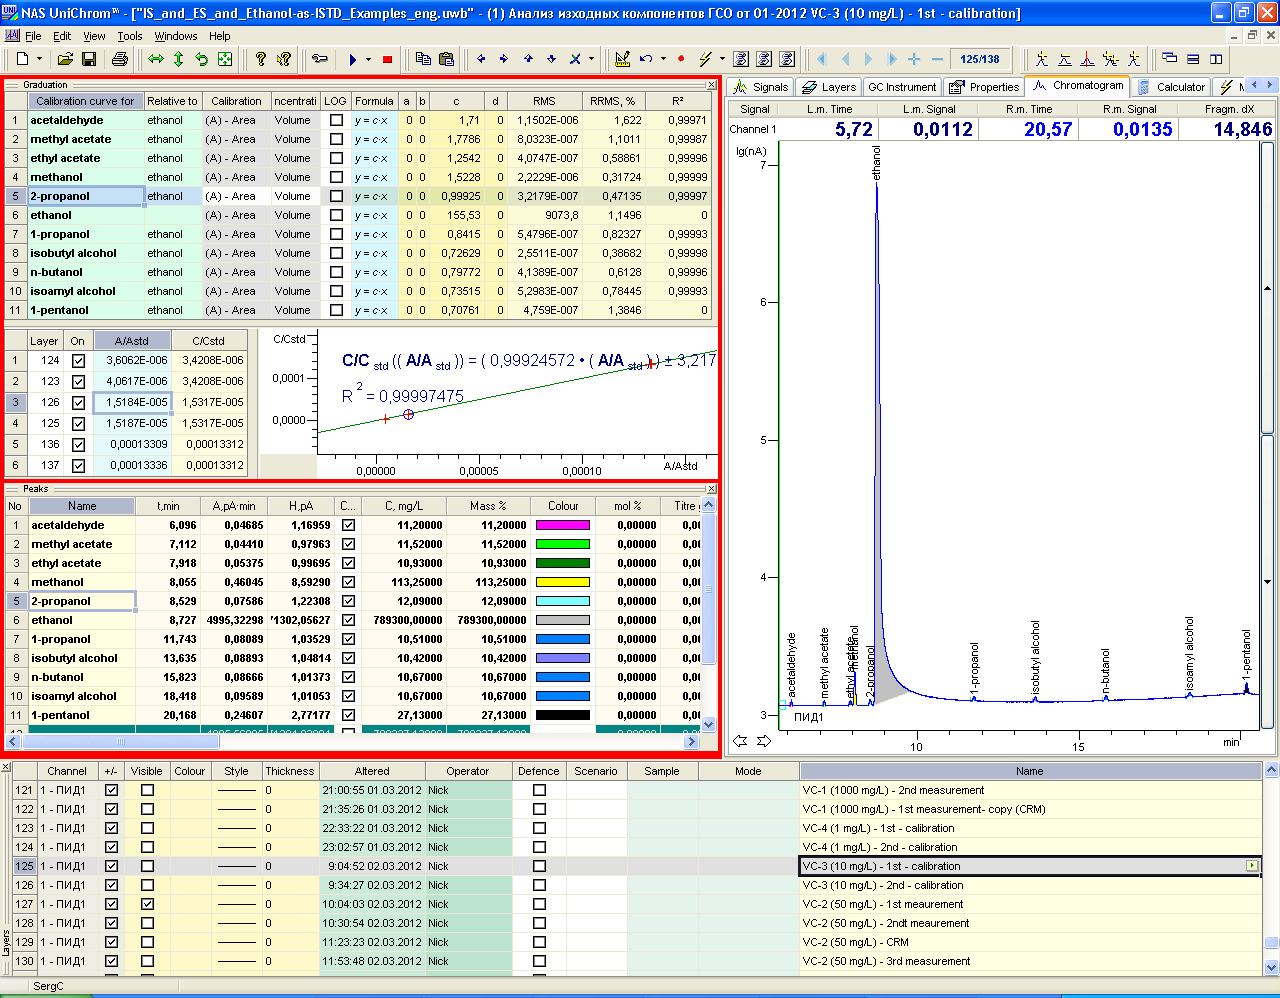
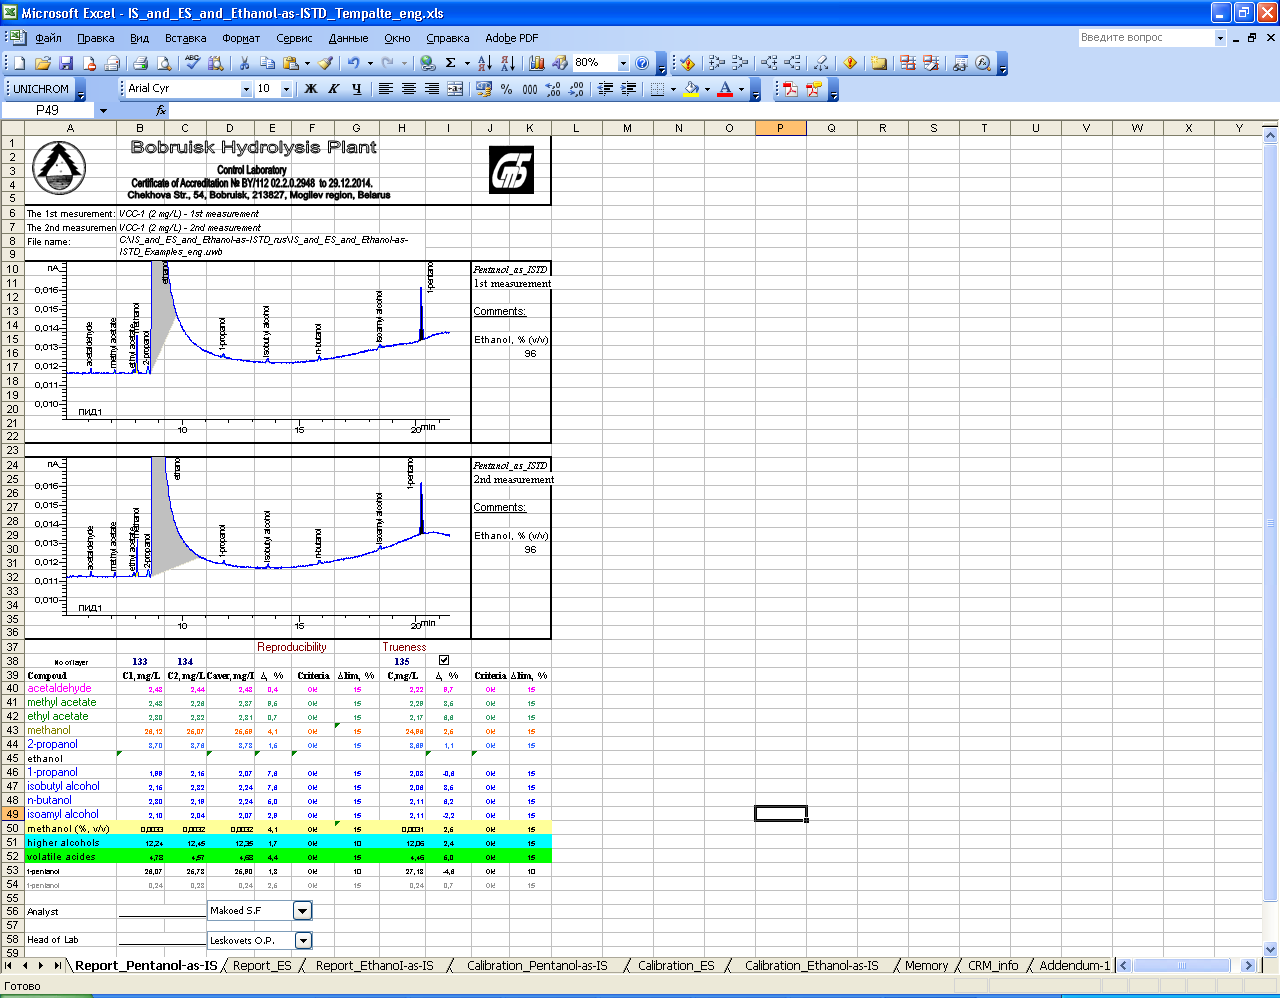
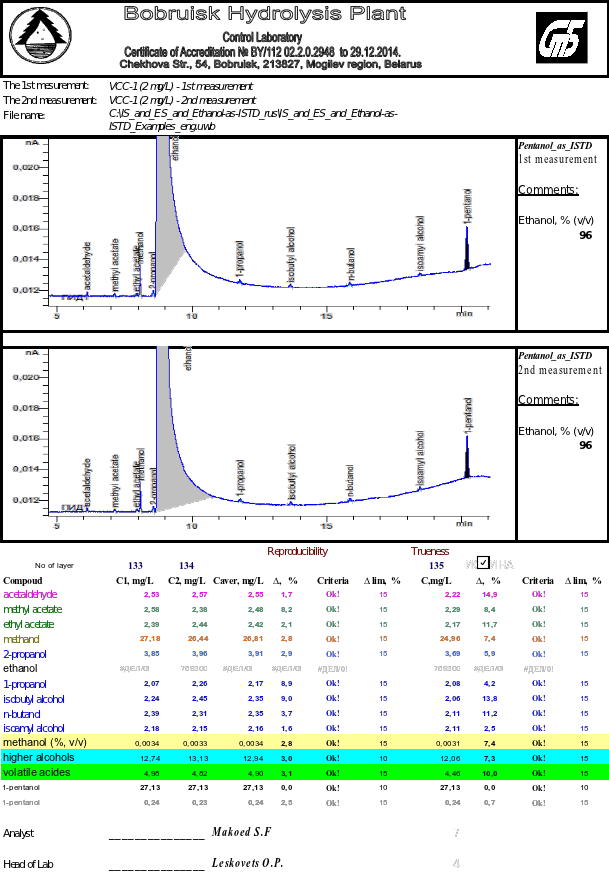
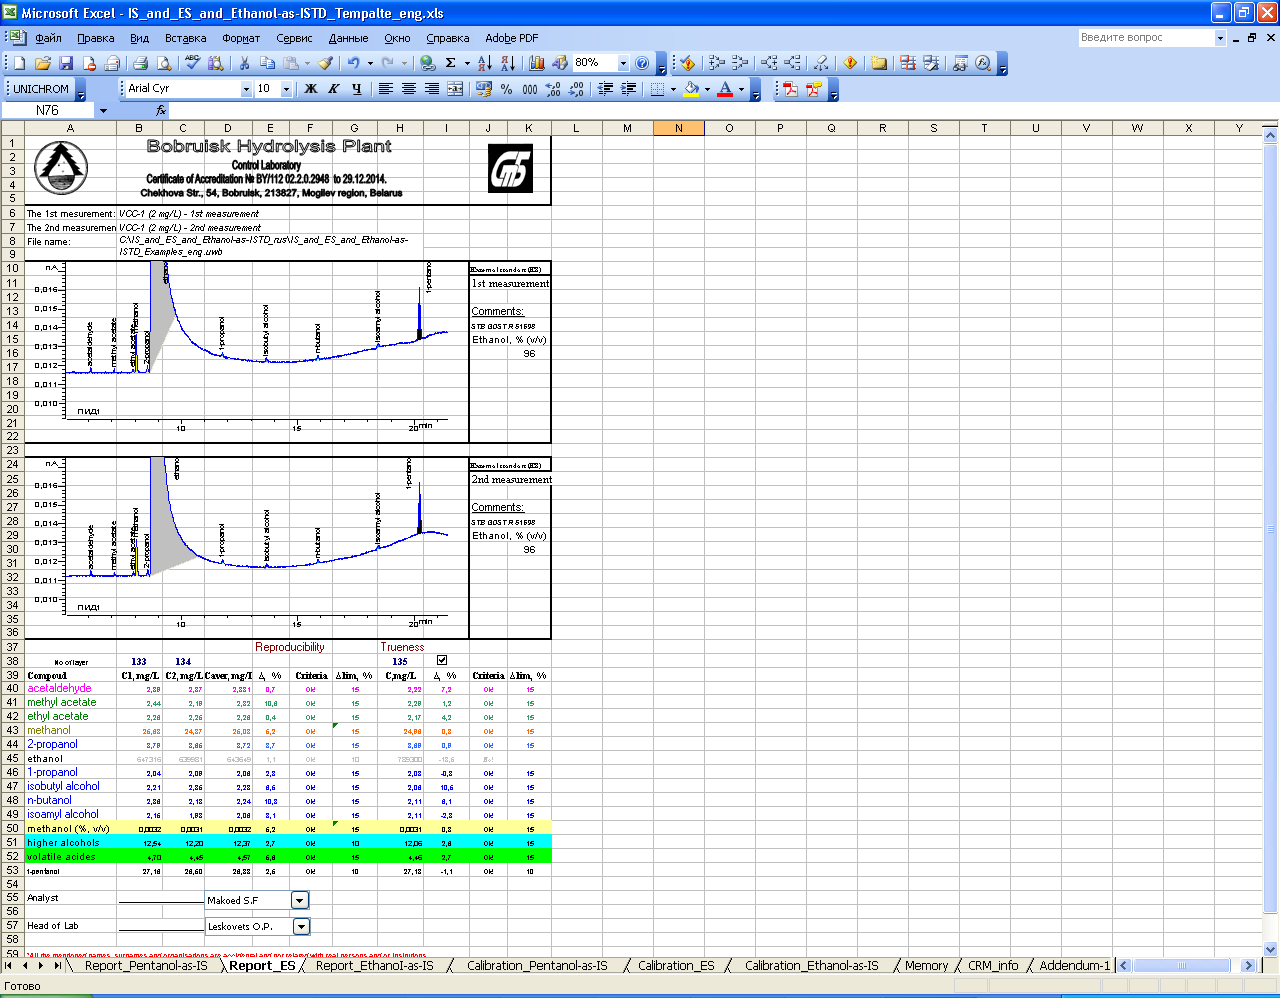
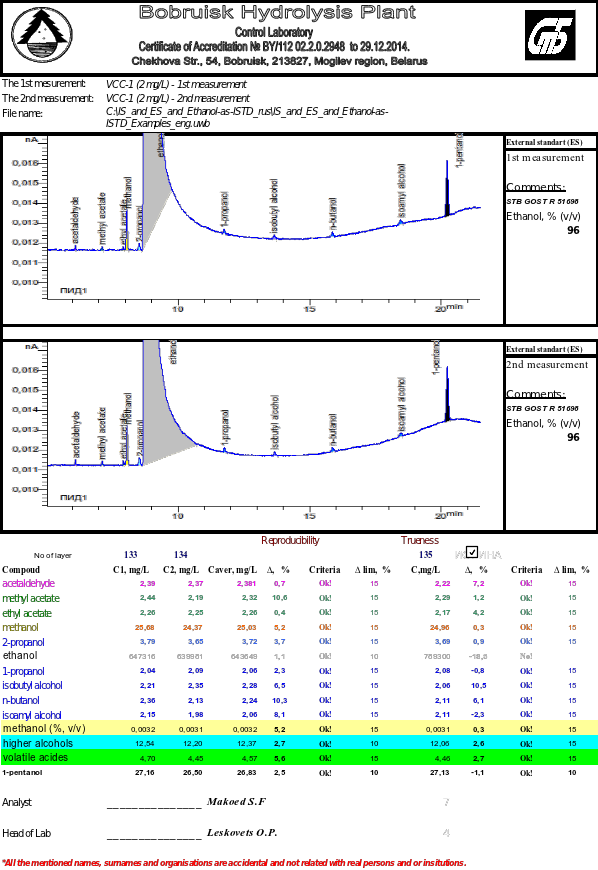
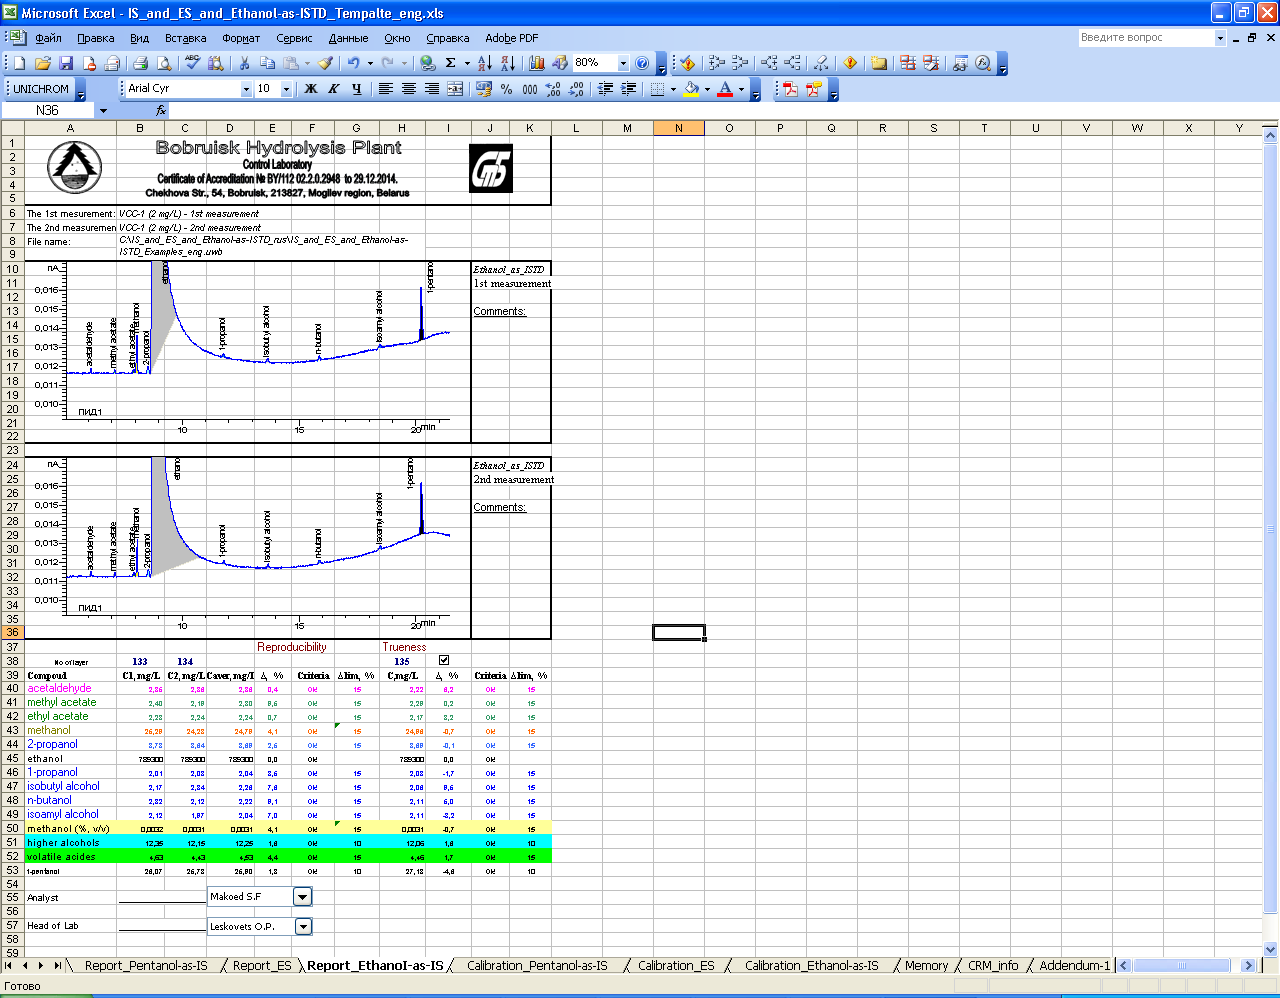
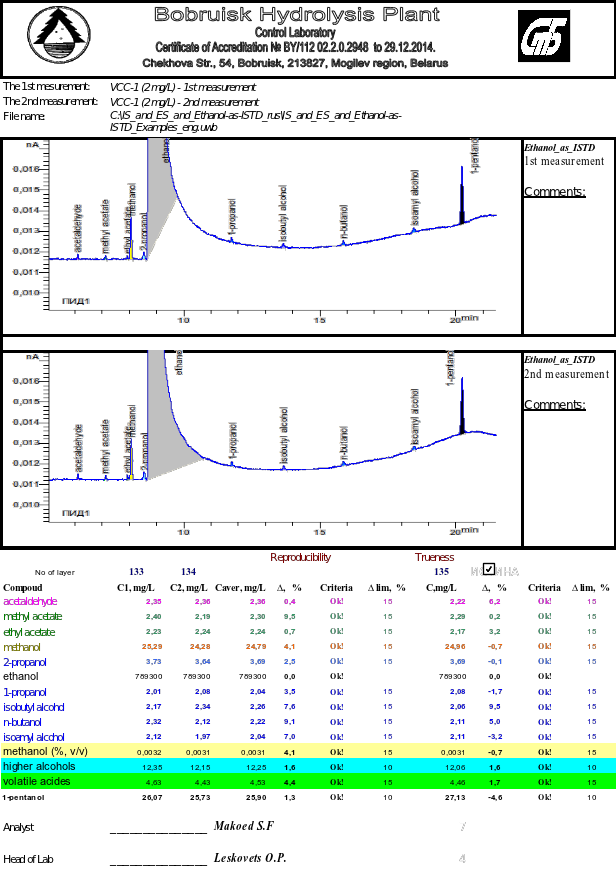
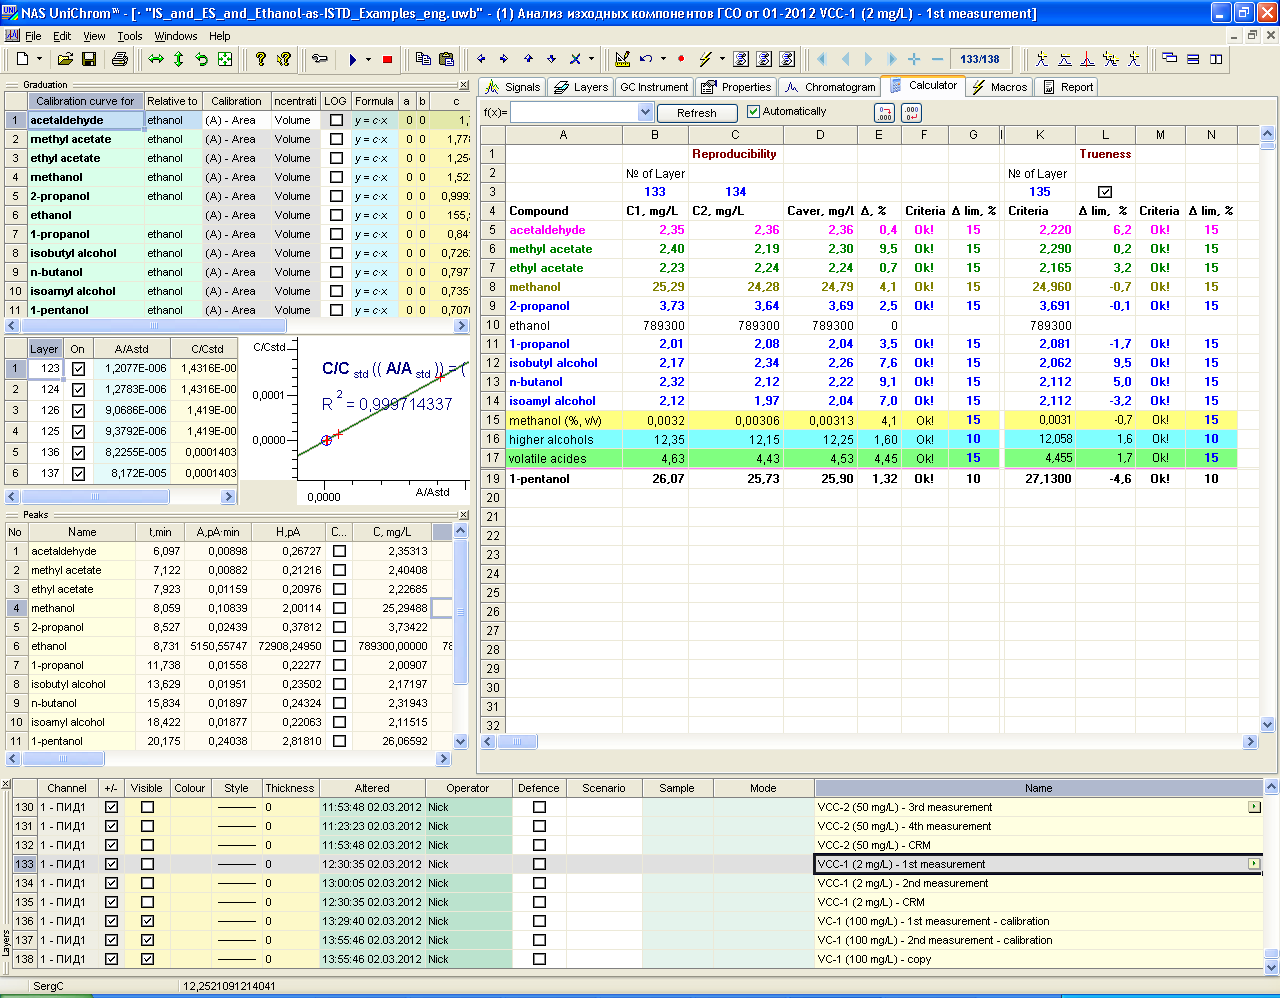
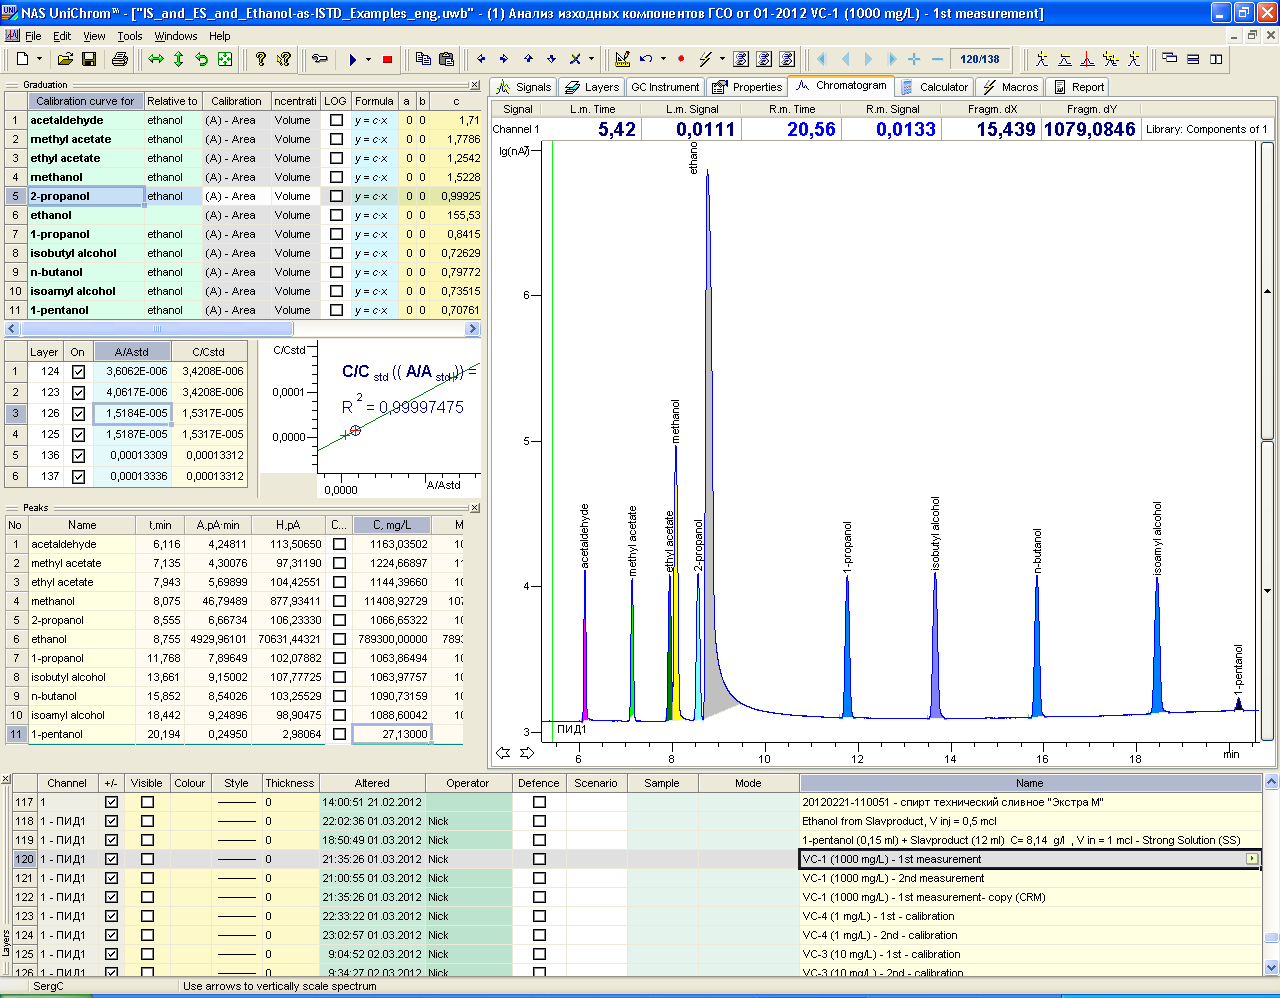
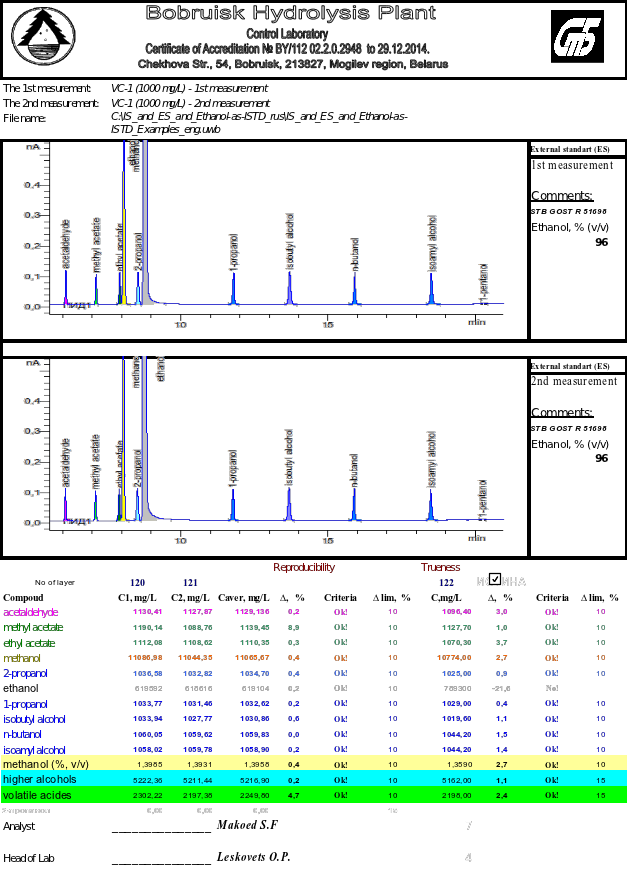
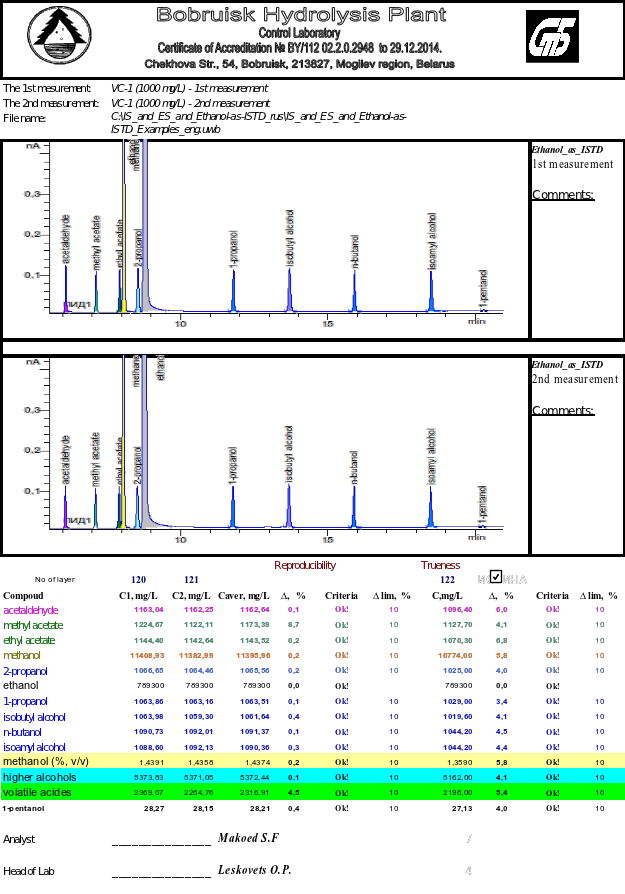
The main obtained experimental results are presented below in the form of screenshots.
Relative detector response factors RF for analyzed compounds relative to ethanol are sufficiently stable in wide regions of impurities concentrations. These relative factors can be tabulated for every certain type device. It follows that the proposed method "ethanol as IS" allows make measurements without often periodic calibration of gas chromatograph. Thousands of testing laboratories all over the world carry out gas chromatographic analysis of volatile compounds in spirit drinks day-and-night. They may test this approach in their real practice. It is important to note that there is no need to perform any additional measurements. This method could be tested while performing current measurements with existing instrumentation. Calculations could be done in parallel by three different methods: using traditional IS method [1–3], ES method [4–8] and using "ethanol as IS".
Commission Regulation (EC) No 2870/2000 of 19 December 2000 laying down Community reference methods for the analysis of spirits drinks, 2000.
AOAC Official Methods 972.10. Alcohol (higher) and ethyl acetate in distilled liquors. Alternative gas chromatographic method, 1975.
AOAC Official Methods 972.11. Methanol in distilled liquors. Gas chromatographic method, 1973.
GOST R 51698-2000. Vodka and ethanol. Gas-chromatographic express-method for determination of toxic microadmixtures content, 2000.
GOST R 51762-2002. Vodka and ethanol from food raw materials. Gas-chromatographic method for determination of carbonic acids and furfural content, 2002.
GOST R 52363-2005. Ethanol containing waste of food alcohol and liqueur-vodka production. Gas-chromatographic method for determination of volatile organic admixtures content, 2005.
GOST R 52788-2007. Ethanol and ethanol containing production. Gas-chromatographic method for determination of crotonaldehyde (denaturant additive), 2007.
GOST R 53419-2009. Raw ethanol from food raw materials. Gas-chromatographic method for determination of volatile organic admixtures, 2009.
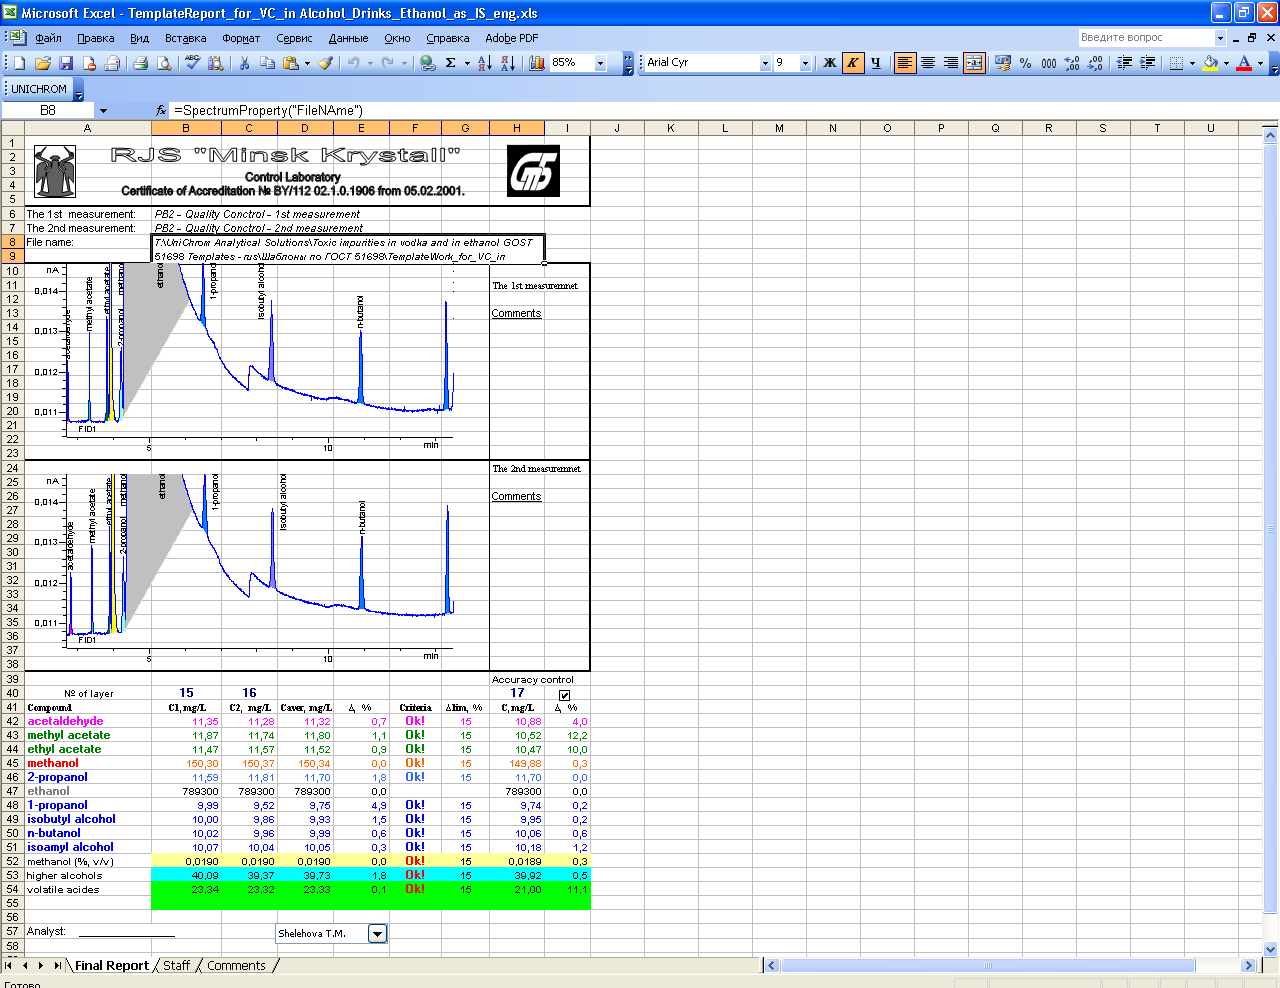
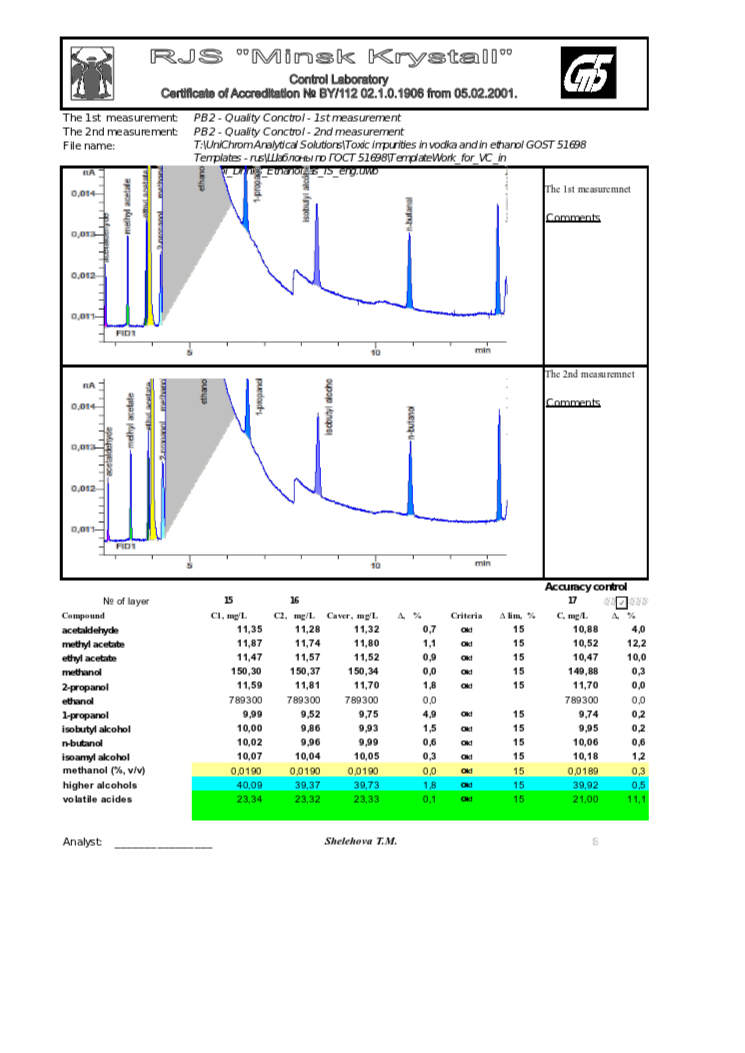
There are the following prepared templates ReportVCADEIS-eng.uwb and ReportVCADEIS-eng.xls for illustration how this method is working.
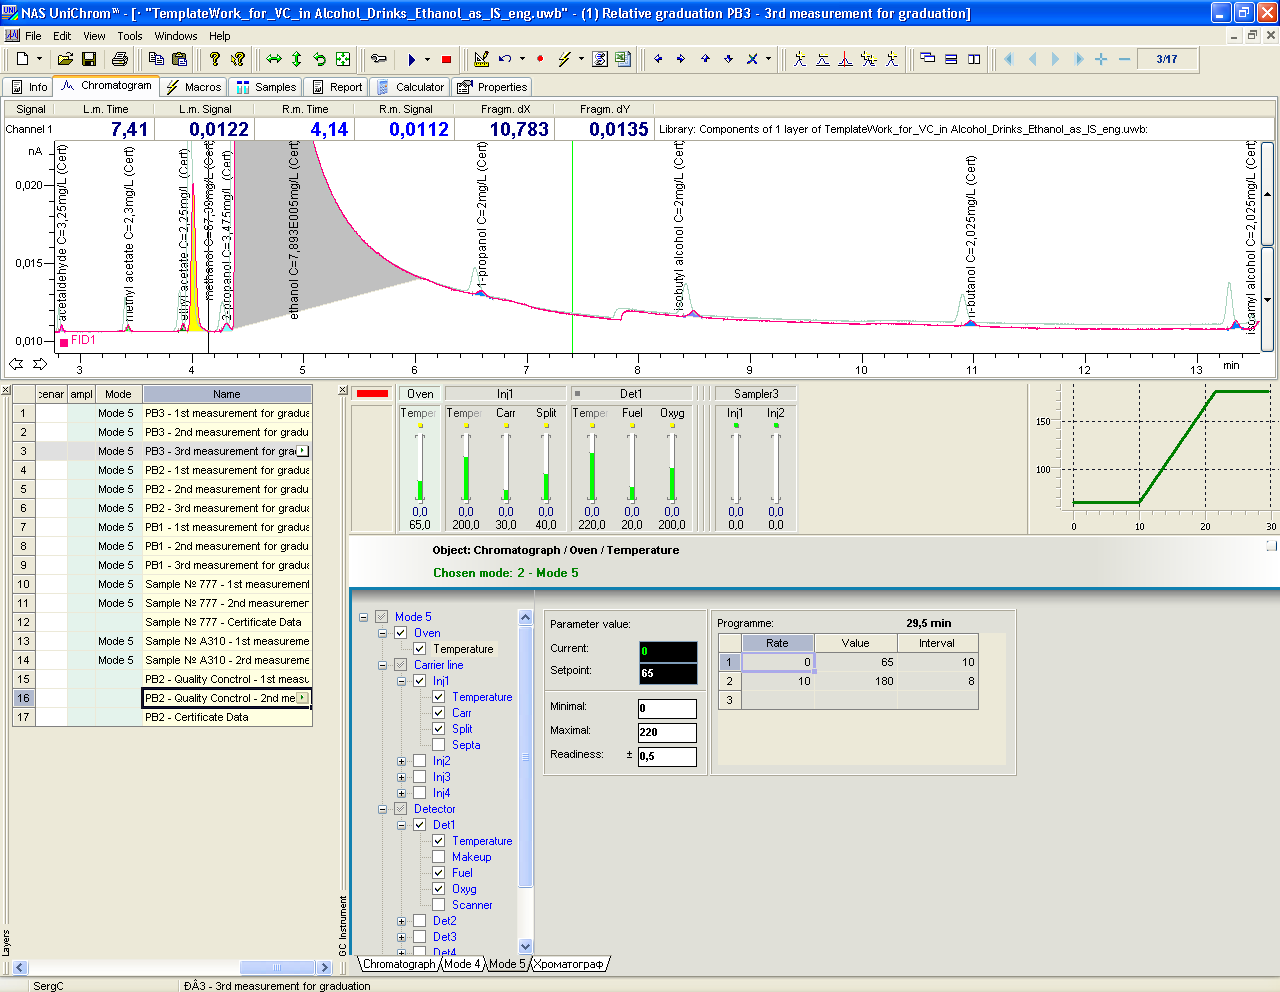
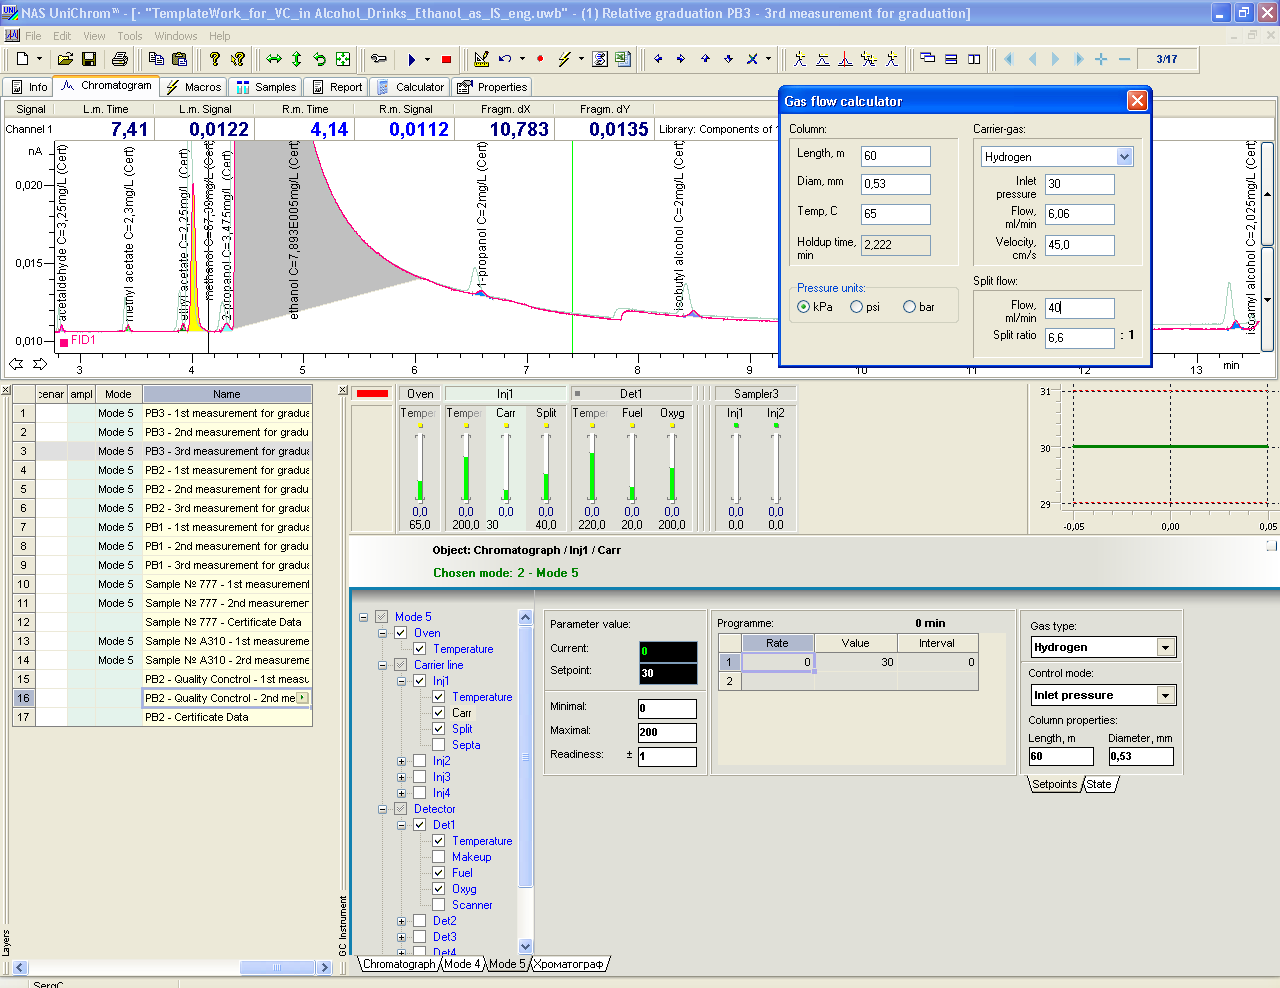
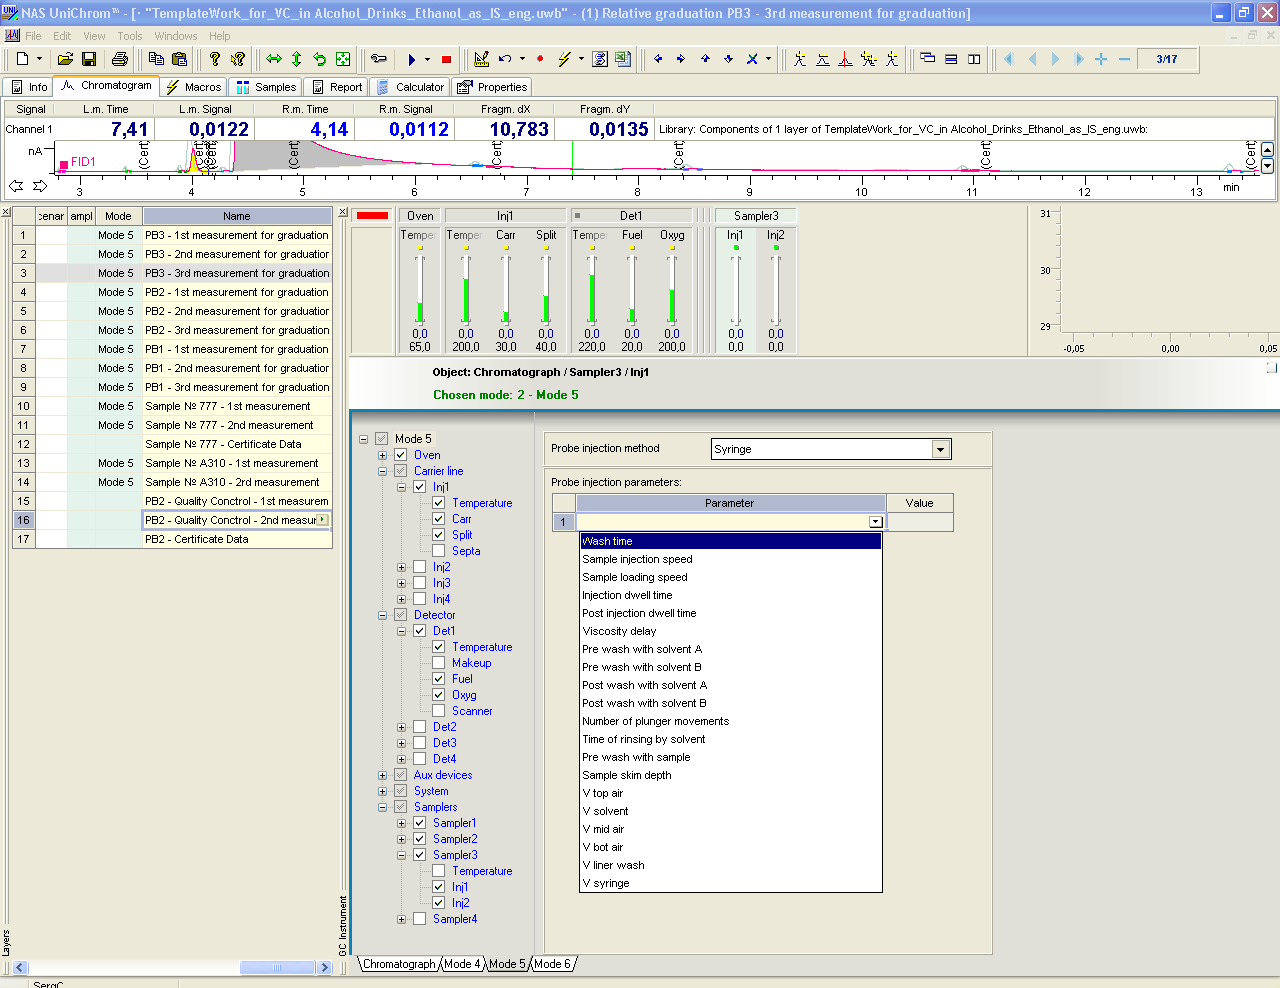
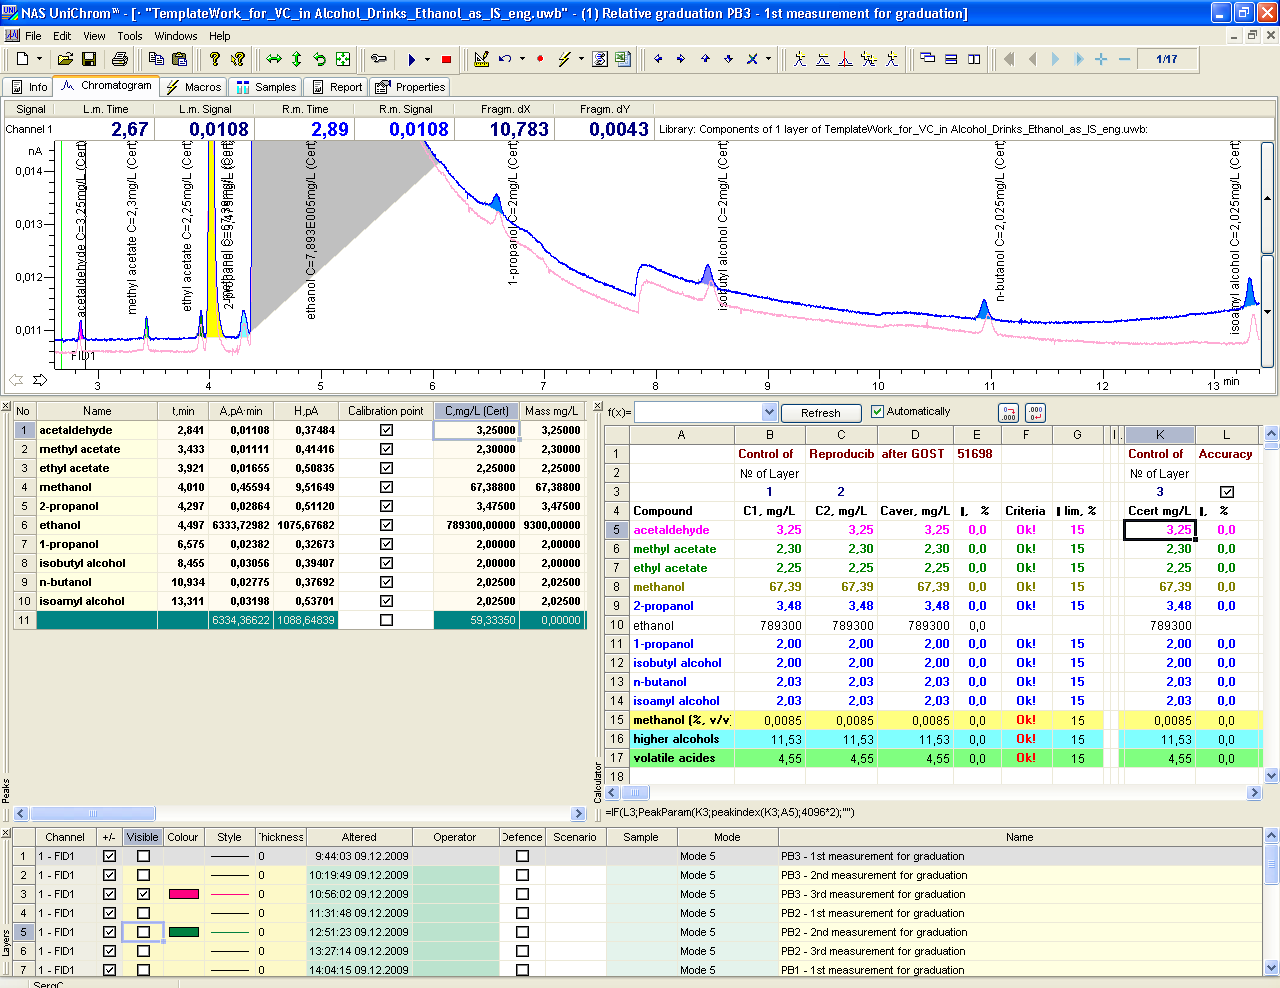
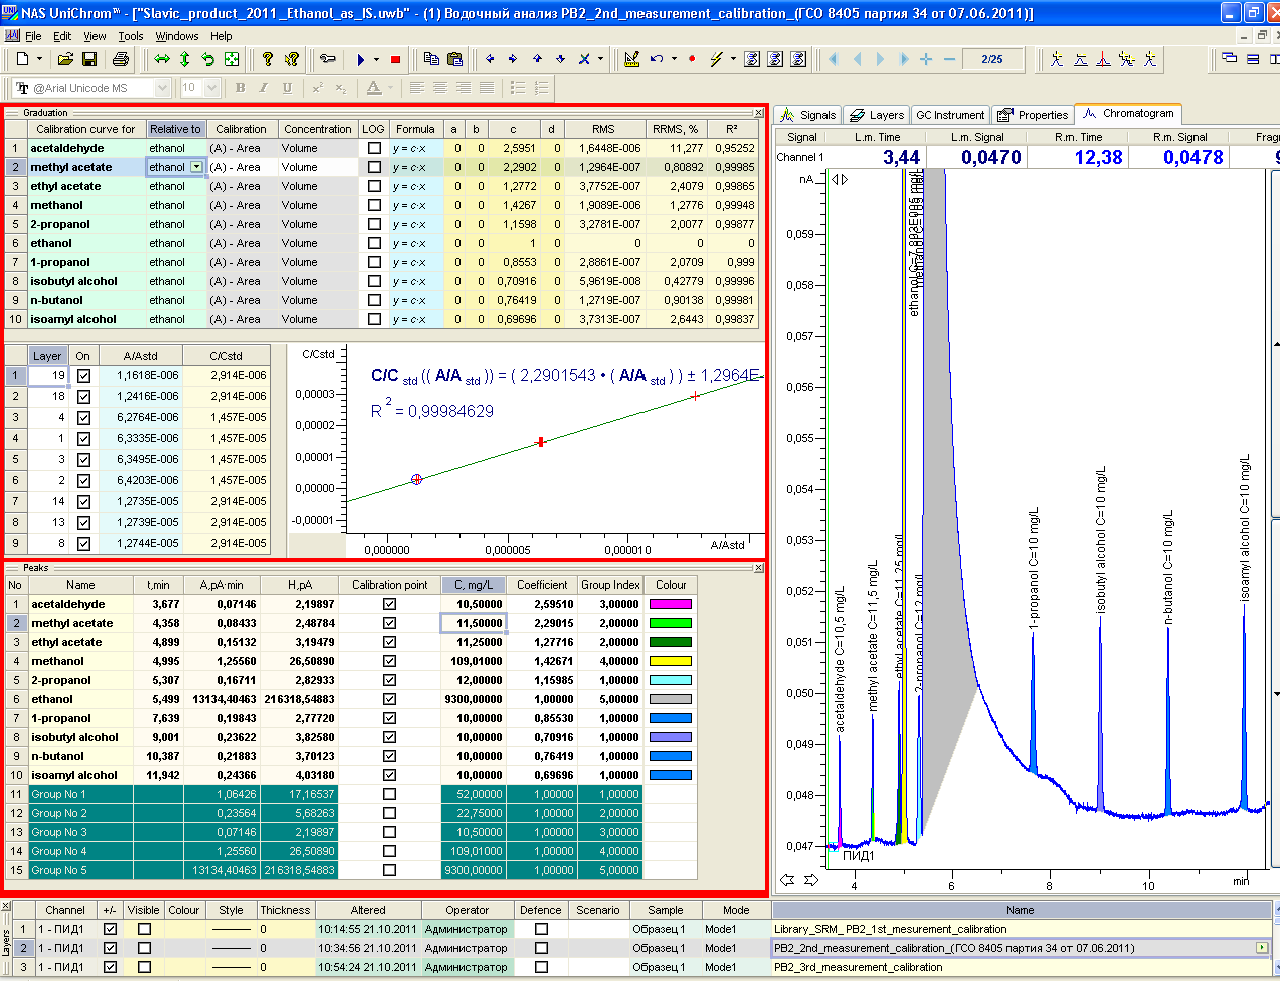
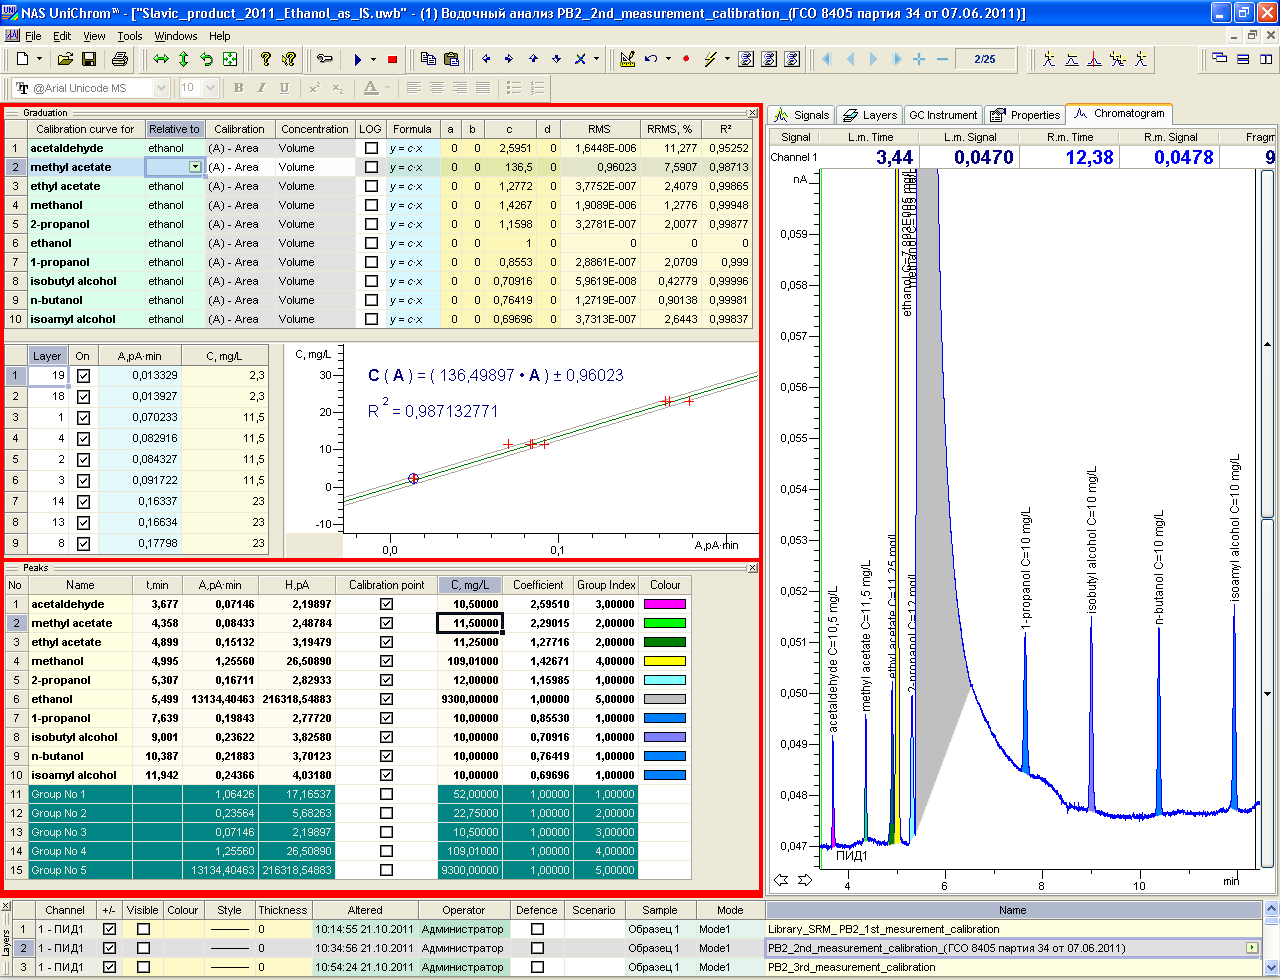
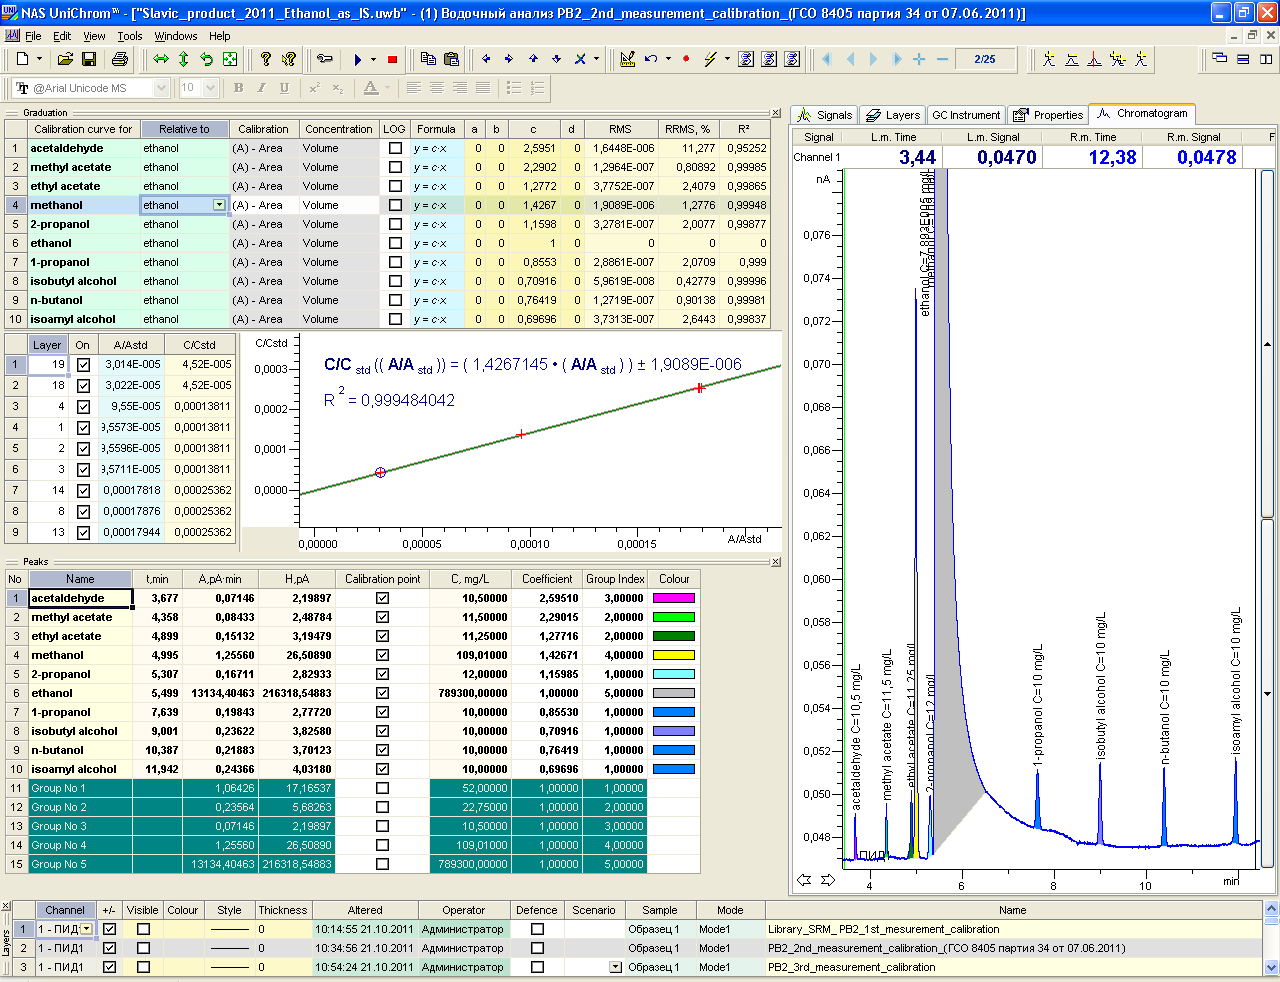
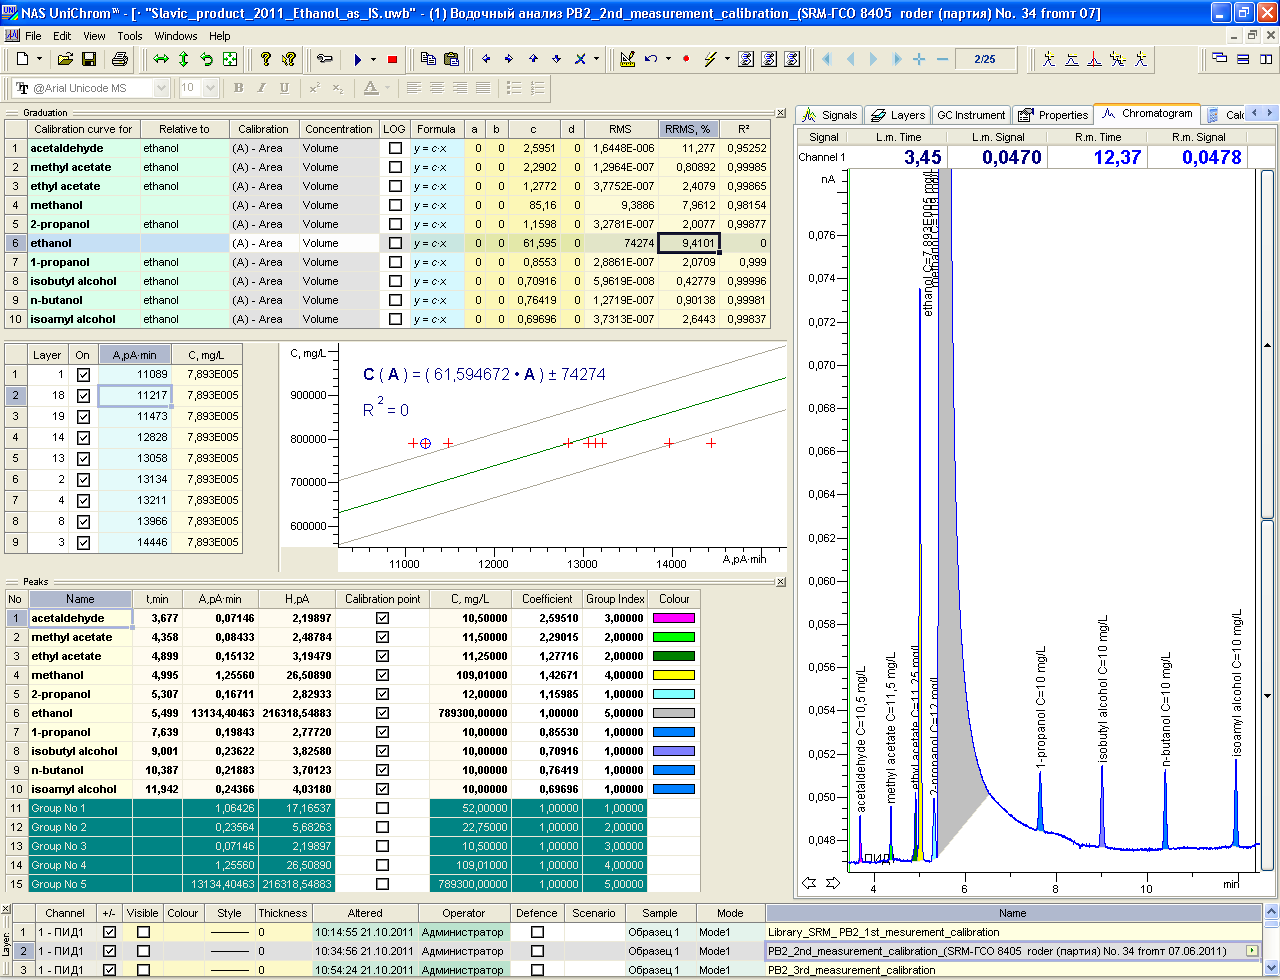
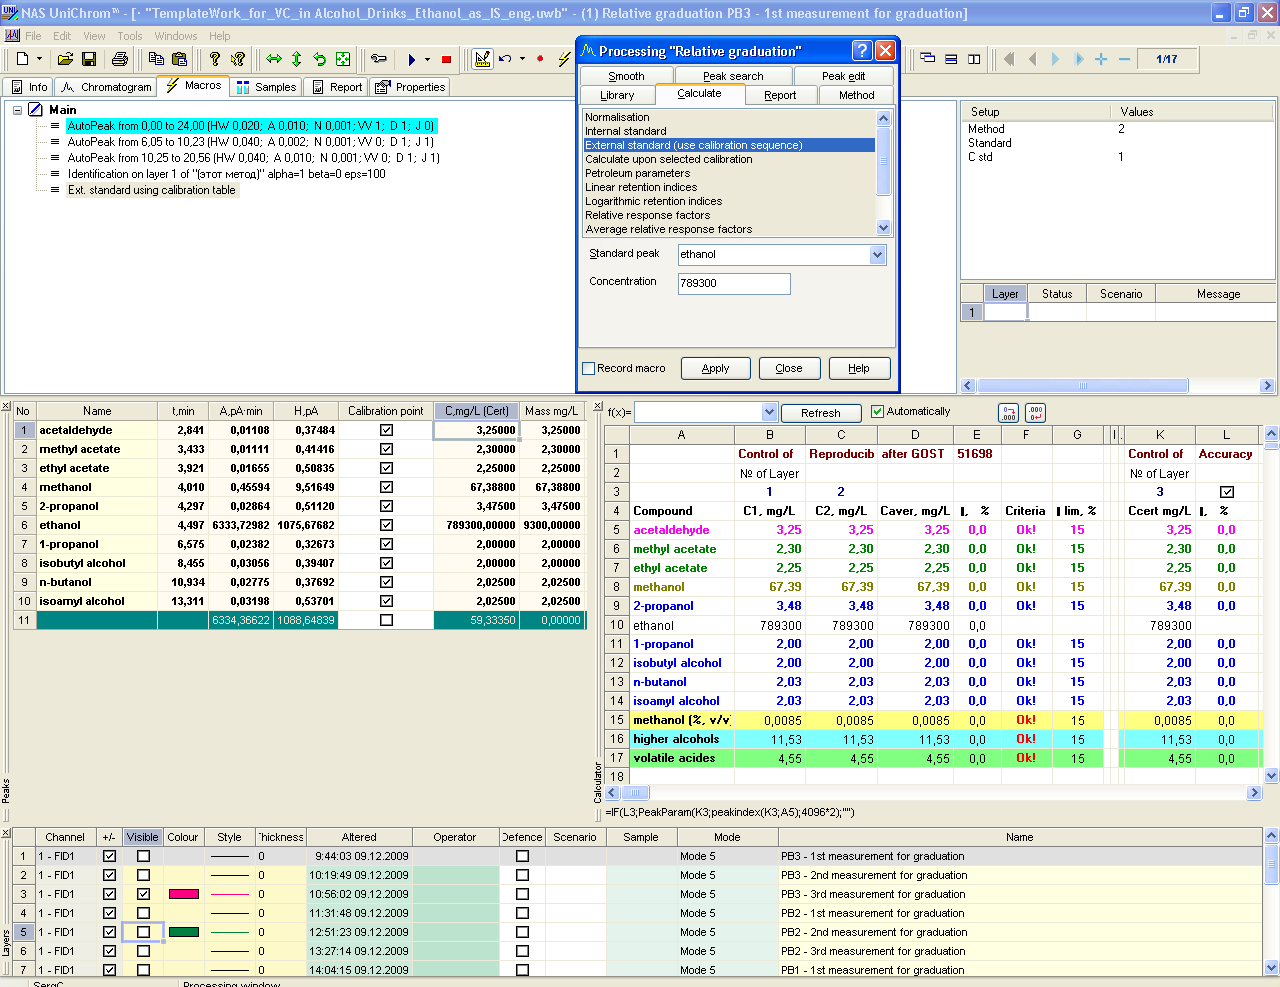
Fig.21 - Layout with presentation of scenario (macros) treatment of measurement data.
| Charapitsa Siarhei | e-mail: chere@inp.bsu.by |
| Ph.D | Tel.: +(375 17) 212 17 26 |
| Mob.: +(375 29) 651 33 91 |